Qlik Sense
summary
Qlik Sense is a self-service data visualization BI tool that enables intuitive exploration and discovery through simple drag-and-drop operations, allowing users without IT or data analysis skills to easily visualize data without relying on experts. It is thoroughly designed for comfortable and intuitive operation on all devices, including smartphones and tablets, even in mobile environments.
Main Features
Flexible visualization
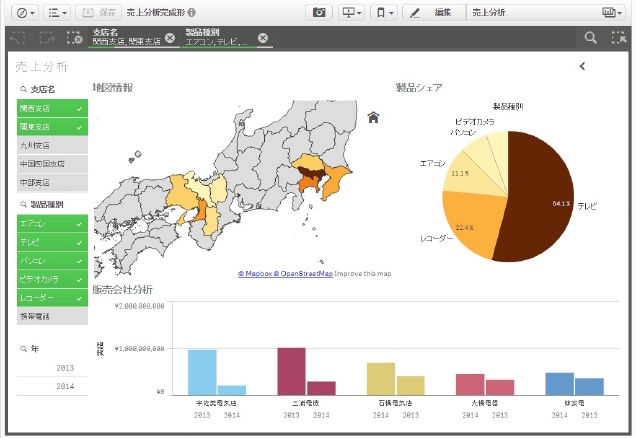
Qlik Sense allows you to easily import multiple data sources you want to use for analysis by simply dragging and dropping them. You can also visualize your data in easy-to-understand colors and sizes by simply selecting tables and graphs of any shape and dragging and dropping them anywhere you like. Not only are data related, but also unrelated data is displayed in gray to find relationships that cannot be discovered by simply narrowing down the data using drill-down.
Free analysis in a mobile environment

Qlik Sense offers a fast and responsive touch-based HTML5 client that is comfortable and intuitive on mobile devices. Regardless of the model or operating system you are using, it displays at the right size for any device and allows you to comfortably visualize, analyze, create, collaborate, and manage any function, no matter where you are.
Presentation with storytelling functionality

Qlik Sense’s storytelling feature allows users to create presentation materials that use the graphs and tables they have created and add explanatory text and illustrations. In addition, the graphs in a presentation provide direct access to data sources, allowing participants to change items and display charts in real time according to their needs for quicker decision making.
-
All company and product names mentioned herein are trademarks or registered trademarks of their respective companies.
Details
Qlik Sense is a next-generation self-service data visualization BI tool that enables intuitive exploration and discovery through simple drag-and-drop operations, allowing users without IT or data analysis skills to easily visualize data without relying on experts. It is thoroughly designed for comfortable and intuitive operation on all devices, including smartphones and tablets, even in mobile environments.
Qlik Sense Licensing Structure
About Qlik Sense Licensing
Qlik Sense is a subscription-based licensing system with the following three types of licenses
| Professional | Developer License. All operations from creating a new app to using a published app are available. |
|---|---|
| Analyzer | Reference License. You can refer to the published application. |
| Analyzer Capacity | As with the Analyzar license, it is possible to reference published applications. The license is hourly and can be used by any number of people within the purchased time. |
TDC SOFT's Qlik Sense implementation support services
In addition to three Qlik Sense Data Architects (as of November 2024) who are “Qlik Sense” certified, our team of engineers boasts extensive experience in building BI/DWH and provides development support service that delivers high implementation effectiveness. We offer the best plan for your plan, such as Qlik Sense Start Pack for quick implementation and Qlik Sense Consulting / Develop Service to support construction with appropriate processes for large-scale use.
Qlik Sense Strat Pack

This plan includes basic environment construction, sample report creation, and skill transfer to the person in charge of Qlik Sense. This plan is recommended for customers who want to start using Qlik Sense in a short period of time.
Qlik Sense Consulting / Develop Service

We provide support for the Qlik Sense implementation process, from requirement definition to prototyping suitable for Qlik Sense by consultants with extensive BI experience, to the development of load scripts and reports by engineers.
Qlik Sense Maintenance and Support Services

For post-operation support, we will propose a support menu and build a system that meets the customer’s operation style and requirements.
-
All company and product names mentioned herein are trademarks or registered trademarks of their respective companies.
Free trial

Free trial
- User registration is required at QlikTech’s website.
Examples of use in health analysis
Analyze the relationship between health checkup results and organization/attendance to achieve health management

Employee health management is an important issue for corporate productivity. By analyzing the tendency of employees whose health condition is deteriorating in combination with the results of health checkups, internal organization, and working conditions, we can visualize organizational trends in order to understand the true causes.
What is the truth that can be seen only by combining multiple data?
| POINT 1 | Identify factors contributing to poor health conditions in specific departments and organizational issues |
|---|---|
| POINT 2 | Recognition of the degree of impact on health status by work status by age and position. |
| POINT 3 | Compare lifestyle and past trends and implement early preventive measures |
Proposed analytical use of combined health-related data
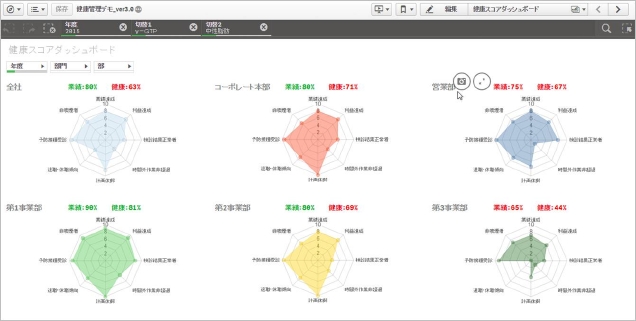
Dashboard for quick overview of overall trends
-
Import health checkup results, performance indicators, and attendance data in CSV and EXCEL format
-
Graphs combining performance and health indicators to visualize trends by organization
Cross-cutting perspectives promote "awareness
-
Easily find attendance correlations that could not be found in the overall trend from the perspective of overtime hours worked
-
Analyze new trends in health abnormalities from the perspective of screening items and historical data
Employee health is corporate health! From Awareness to Action
-
Improve employee health awareness by establishing KPIs based on health checkup results and attendance data
-
Easily displays a list of each individual’s health status
-
All company and product names mentioned herein are trademarks or registered trademarks of their respective companies.
-
Health Management® is a registered trademark of the NPO Kenko Keiei Kenkyukai.