Nav toggle
Products & Services
About TDC SOFT Inc.
About TDC SOFT Inc.
Company Profile
Purpose, Corporate Philosophy and Action Guidelines
Message from the Representative
Our Business
Organization Chart
Affiliated Company
History
Access
Commitment to Social Contribution Activities
Gallery
TDC's Pickup
Basic Policy
Corporate Governance
Internal Control System Basic Policy
Information Security
Privacy Policy
TDC-CSIRT
Quality Initiatives
Human resource development for project management
Acquisition of ISO9001 Certification
TDC Soft Group Human Rights Basic Policy
Promotion of Women's Activities
Personnel System
Health Management Policy
Environmental Policy
Multistakeholder Policy
Site Policy
Social Media Operation Guidelines
TDC SOFT Group Basic Supply Chain Policy
Close
Recruitment
IR Information
IR Information
Financial and Performance Information
IR Calendar
Stock Administration FAQs
Public Announcement
Disclaimer
Management Policy
Message from the Representative
Mid-term Management Plan
Business and Other Risks
Management Indicators and Achievements
Stock-related
Dividend Policy
General Meeting of Shareholders
Stock Information
IR Materials
Financial Statements
Financial Results Briefing Materials
Annual Securities Reports, etc.
Annual Report
Video Library
Close
News
Sustainability
Sustainability
Basic Sustainability Policy
Sustainability Structure
Realization of a smart society
Approaches to Environmental Issues
Environmental Policy
Approaches to Social Issues
Human Resource Development Program
Stakeholder Relations and Activities Policy
Respect for Human Rights
Multistakeholder Policy
Corporate Governance Initiatives
Corporate Governance
Internal Control System Basic Policy
Information Security
Privacy Policy
TDC-CSIRT
Quality Initiatives
Acquisition of ISO9001 Certification
Sustainability Data/Reports
Close
Contact Us
JP
EN
Search
Enter search keyword
Search
Close
Products & Services
About TDC SOFT Inc.
About TDC SOFT Inc.
Company Profile
Purpose, Corporate Philosophy and Action Guidelines
Message from the Representative
Our Business
Organization Chart
Affiliated Company
History
Access
Commitment to Social Contribution Activities
Gallery
TDC's Pickup
Basic Policy
Basic Policy TOP
Corporate Governance
Internal Control System Basic Policy
Information Security
Privacy Policy
TDC-CSIRT
Quality Initiatives
Human resource development for project management
Acquisition of ISO9001 Certification
TDC Soft Group Human Rights Basic Policy
Promotion of Women's Activities
Personnel System
Health Management Policy
Environmental Policy
Multistakeholder Policy
Site Policy
Social Media Operation Guidelines
TDC SOFT Group Basic Supply Chain Policy
Recruitment
IR Information
IR Information
Financial and Performance Information
IR Calendar
Stock Administration FAQs
Public Announcement
Disclaimer
Management Policy
Management Policy TOP
Message from the Representative
Mid-term Management Plan
Business and Other Risks
Management Indicators and Achievements
Stock-related
Stock-related TOP
Dividend Policy
General Meeting of Shareholders
Stock Information
IR Materials
IR Materials TOP
Financial Statements
Financial Results Briefing Materials
Annual Securities Reports, etc.
Annual Report
Video Library
News
Sustainability
Sustainability
Basic Sustainability Policy
Sustainability Structure
Realization of a smart society
Approaches to Environmental Issues
Environmental Policy
Approaches to Social Issues
Approaches to Social Issues TOP
Human Resource Development Program
Stakeholder Relations and Activities Policy
Respect for Human Rights
Multistakeholder Policy
Corporate Governance Initiatives
Corporate Governance Initiatives TOP
Corporate Governance
Internal Control System Basic Policy
Information Security
Privacy Policy
TDC-CSIRT
Quality Initiatives
Acquisition of ISO9001 Certification
Sustainability Data/Reports
Contact Us
JP
EN
Enter search keyword
Search
Close
FINANCE
Financial and Performance Information
Home
IR Information
Financial and Performance Information
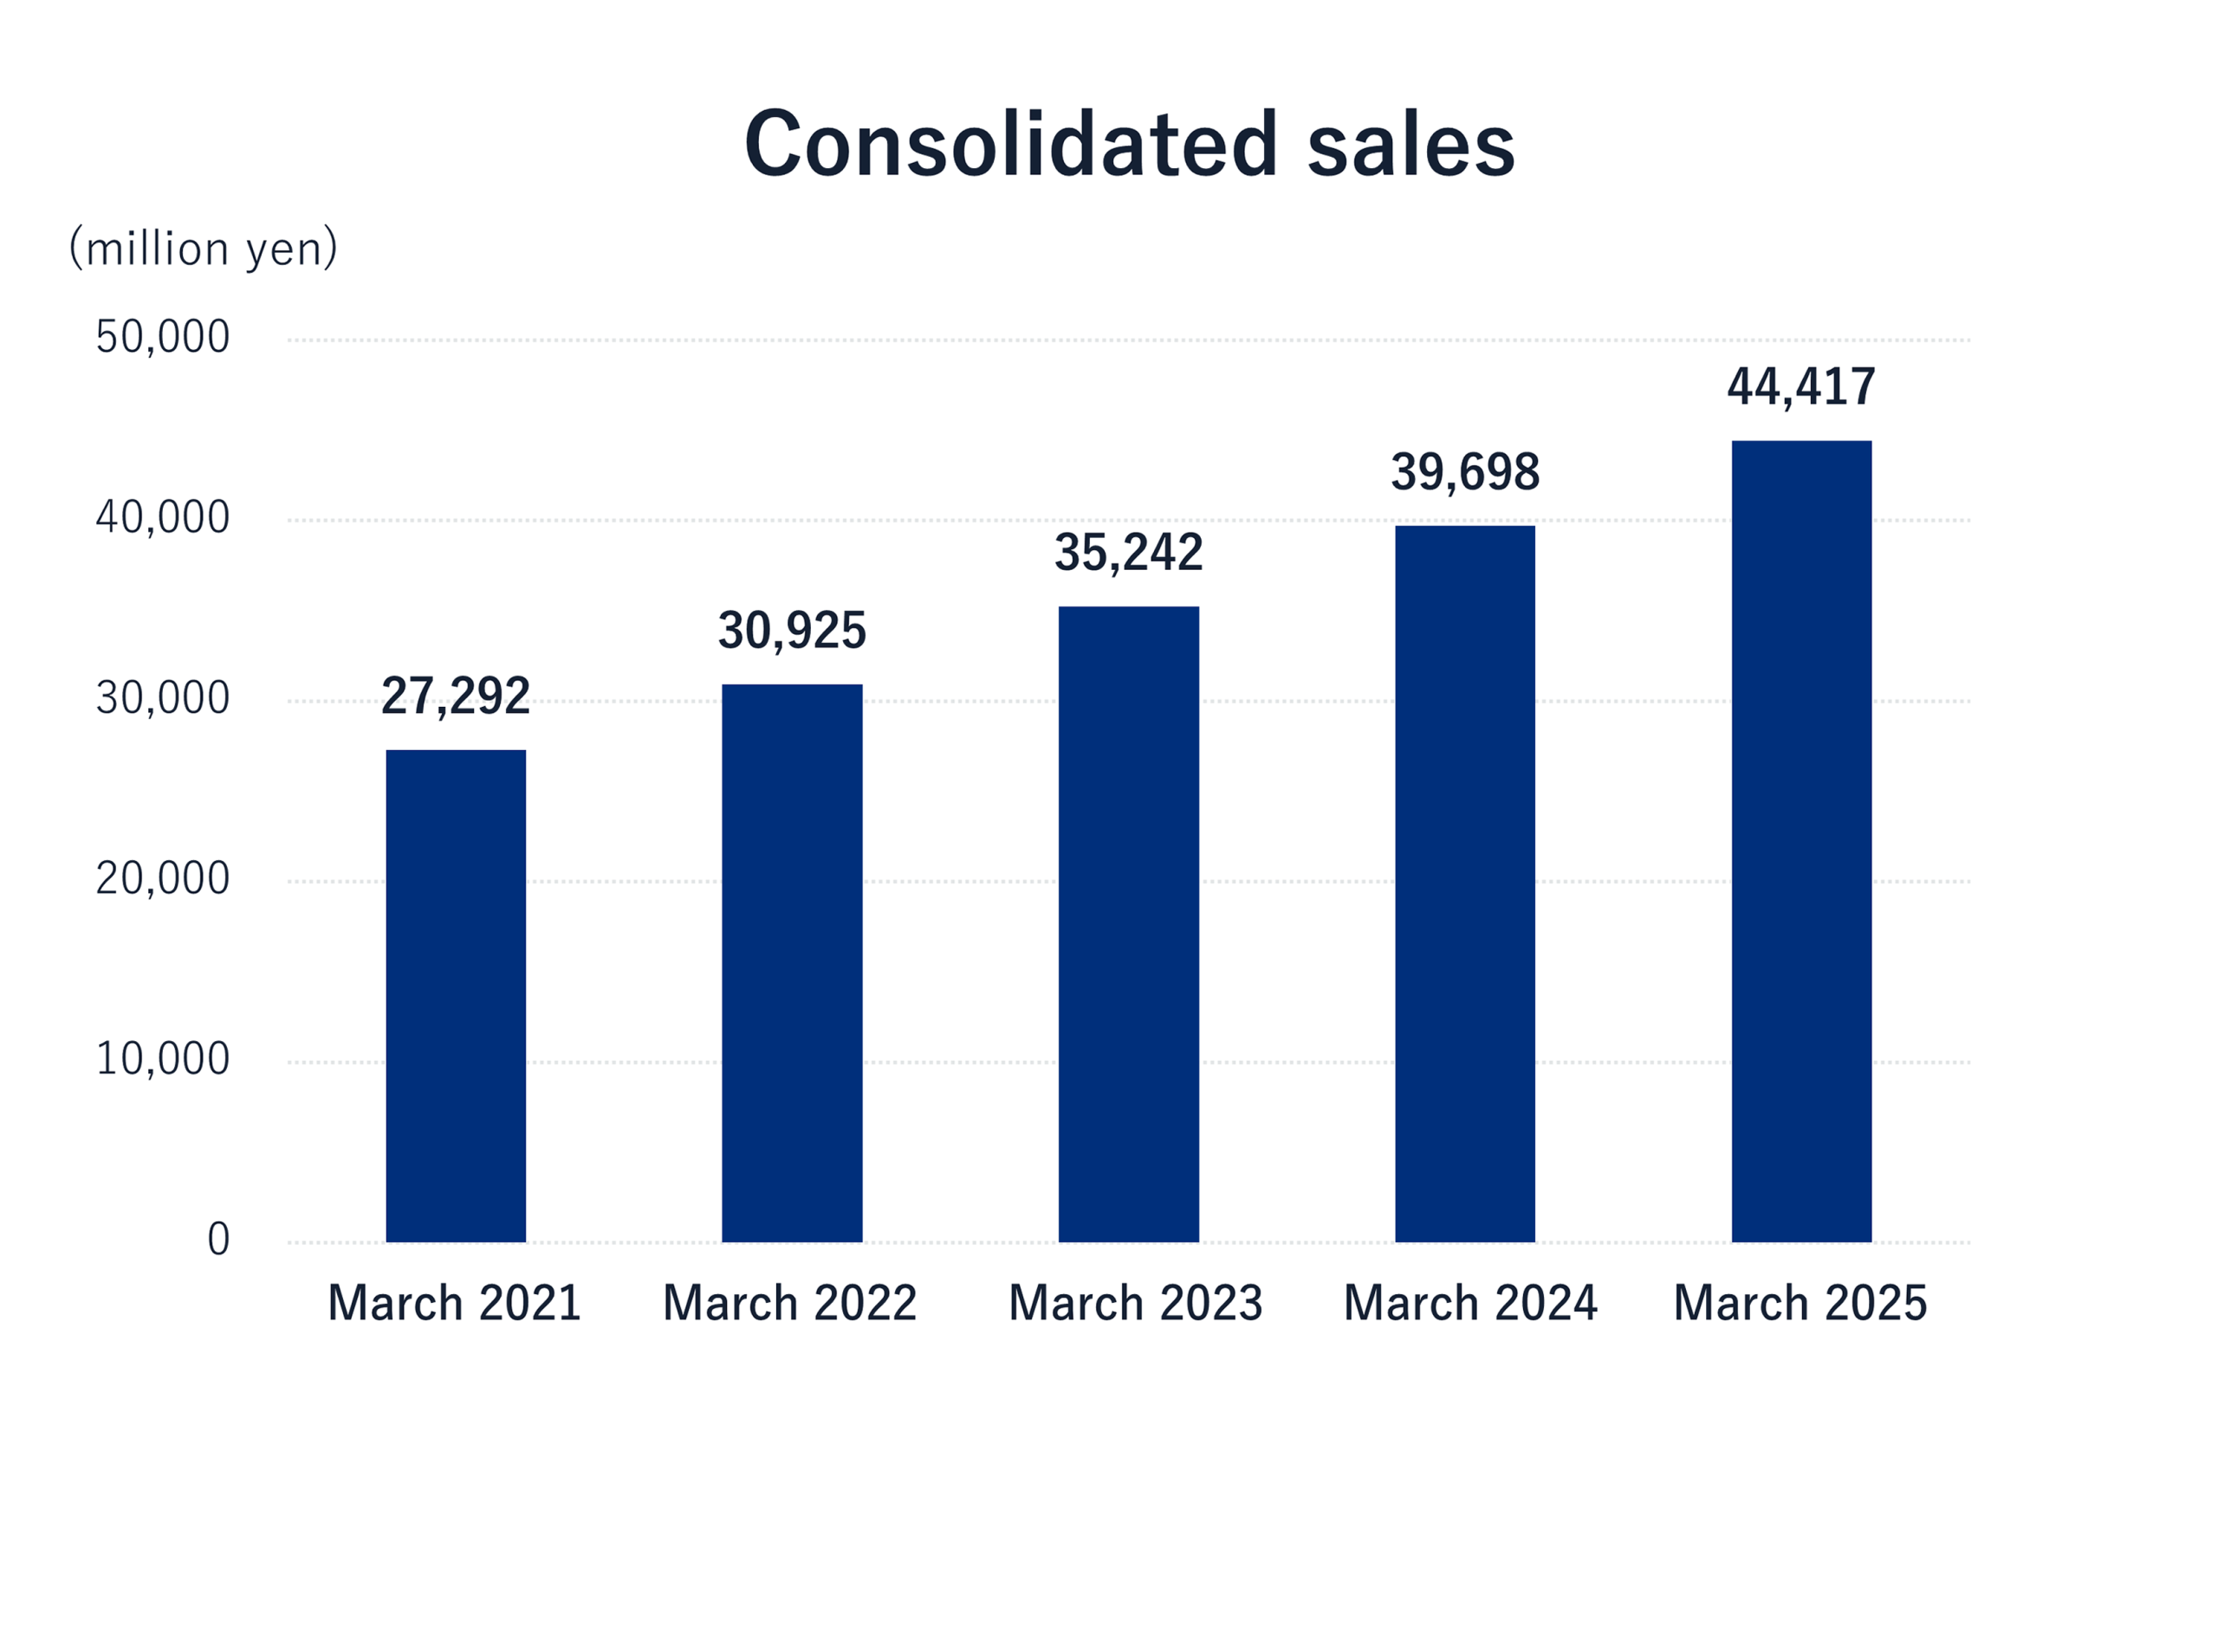
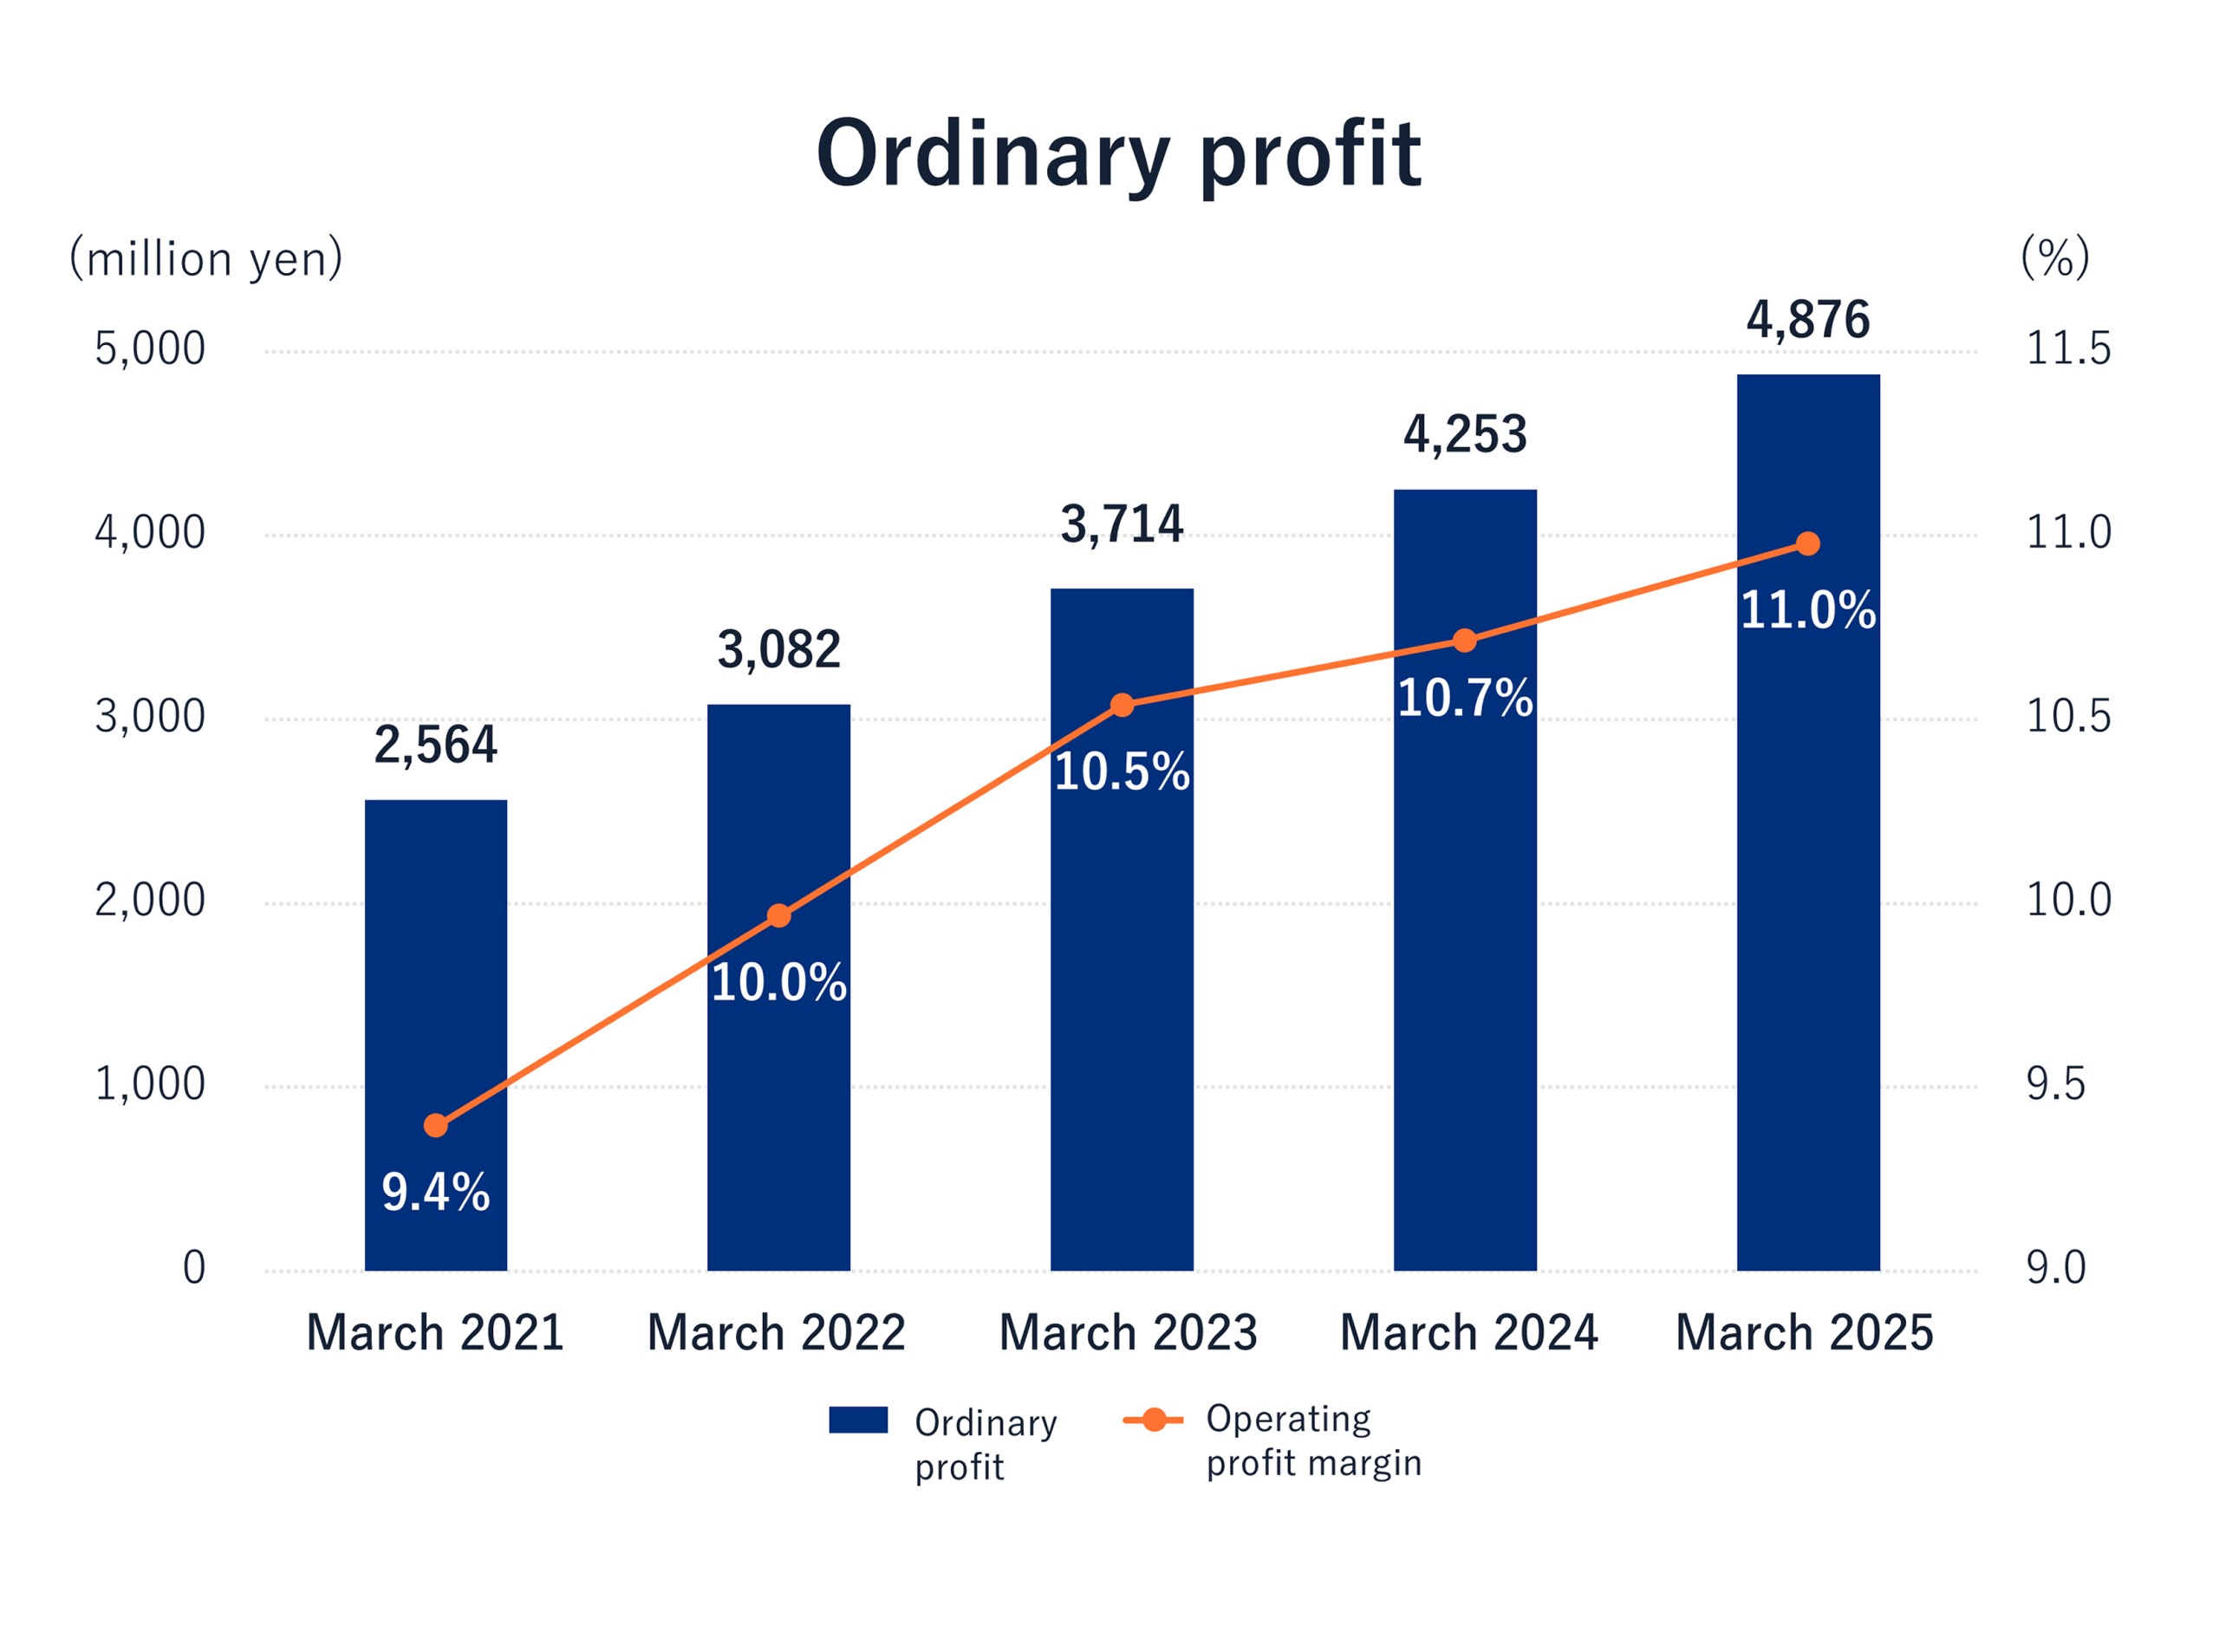
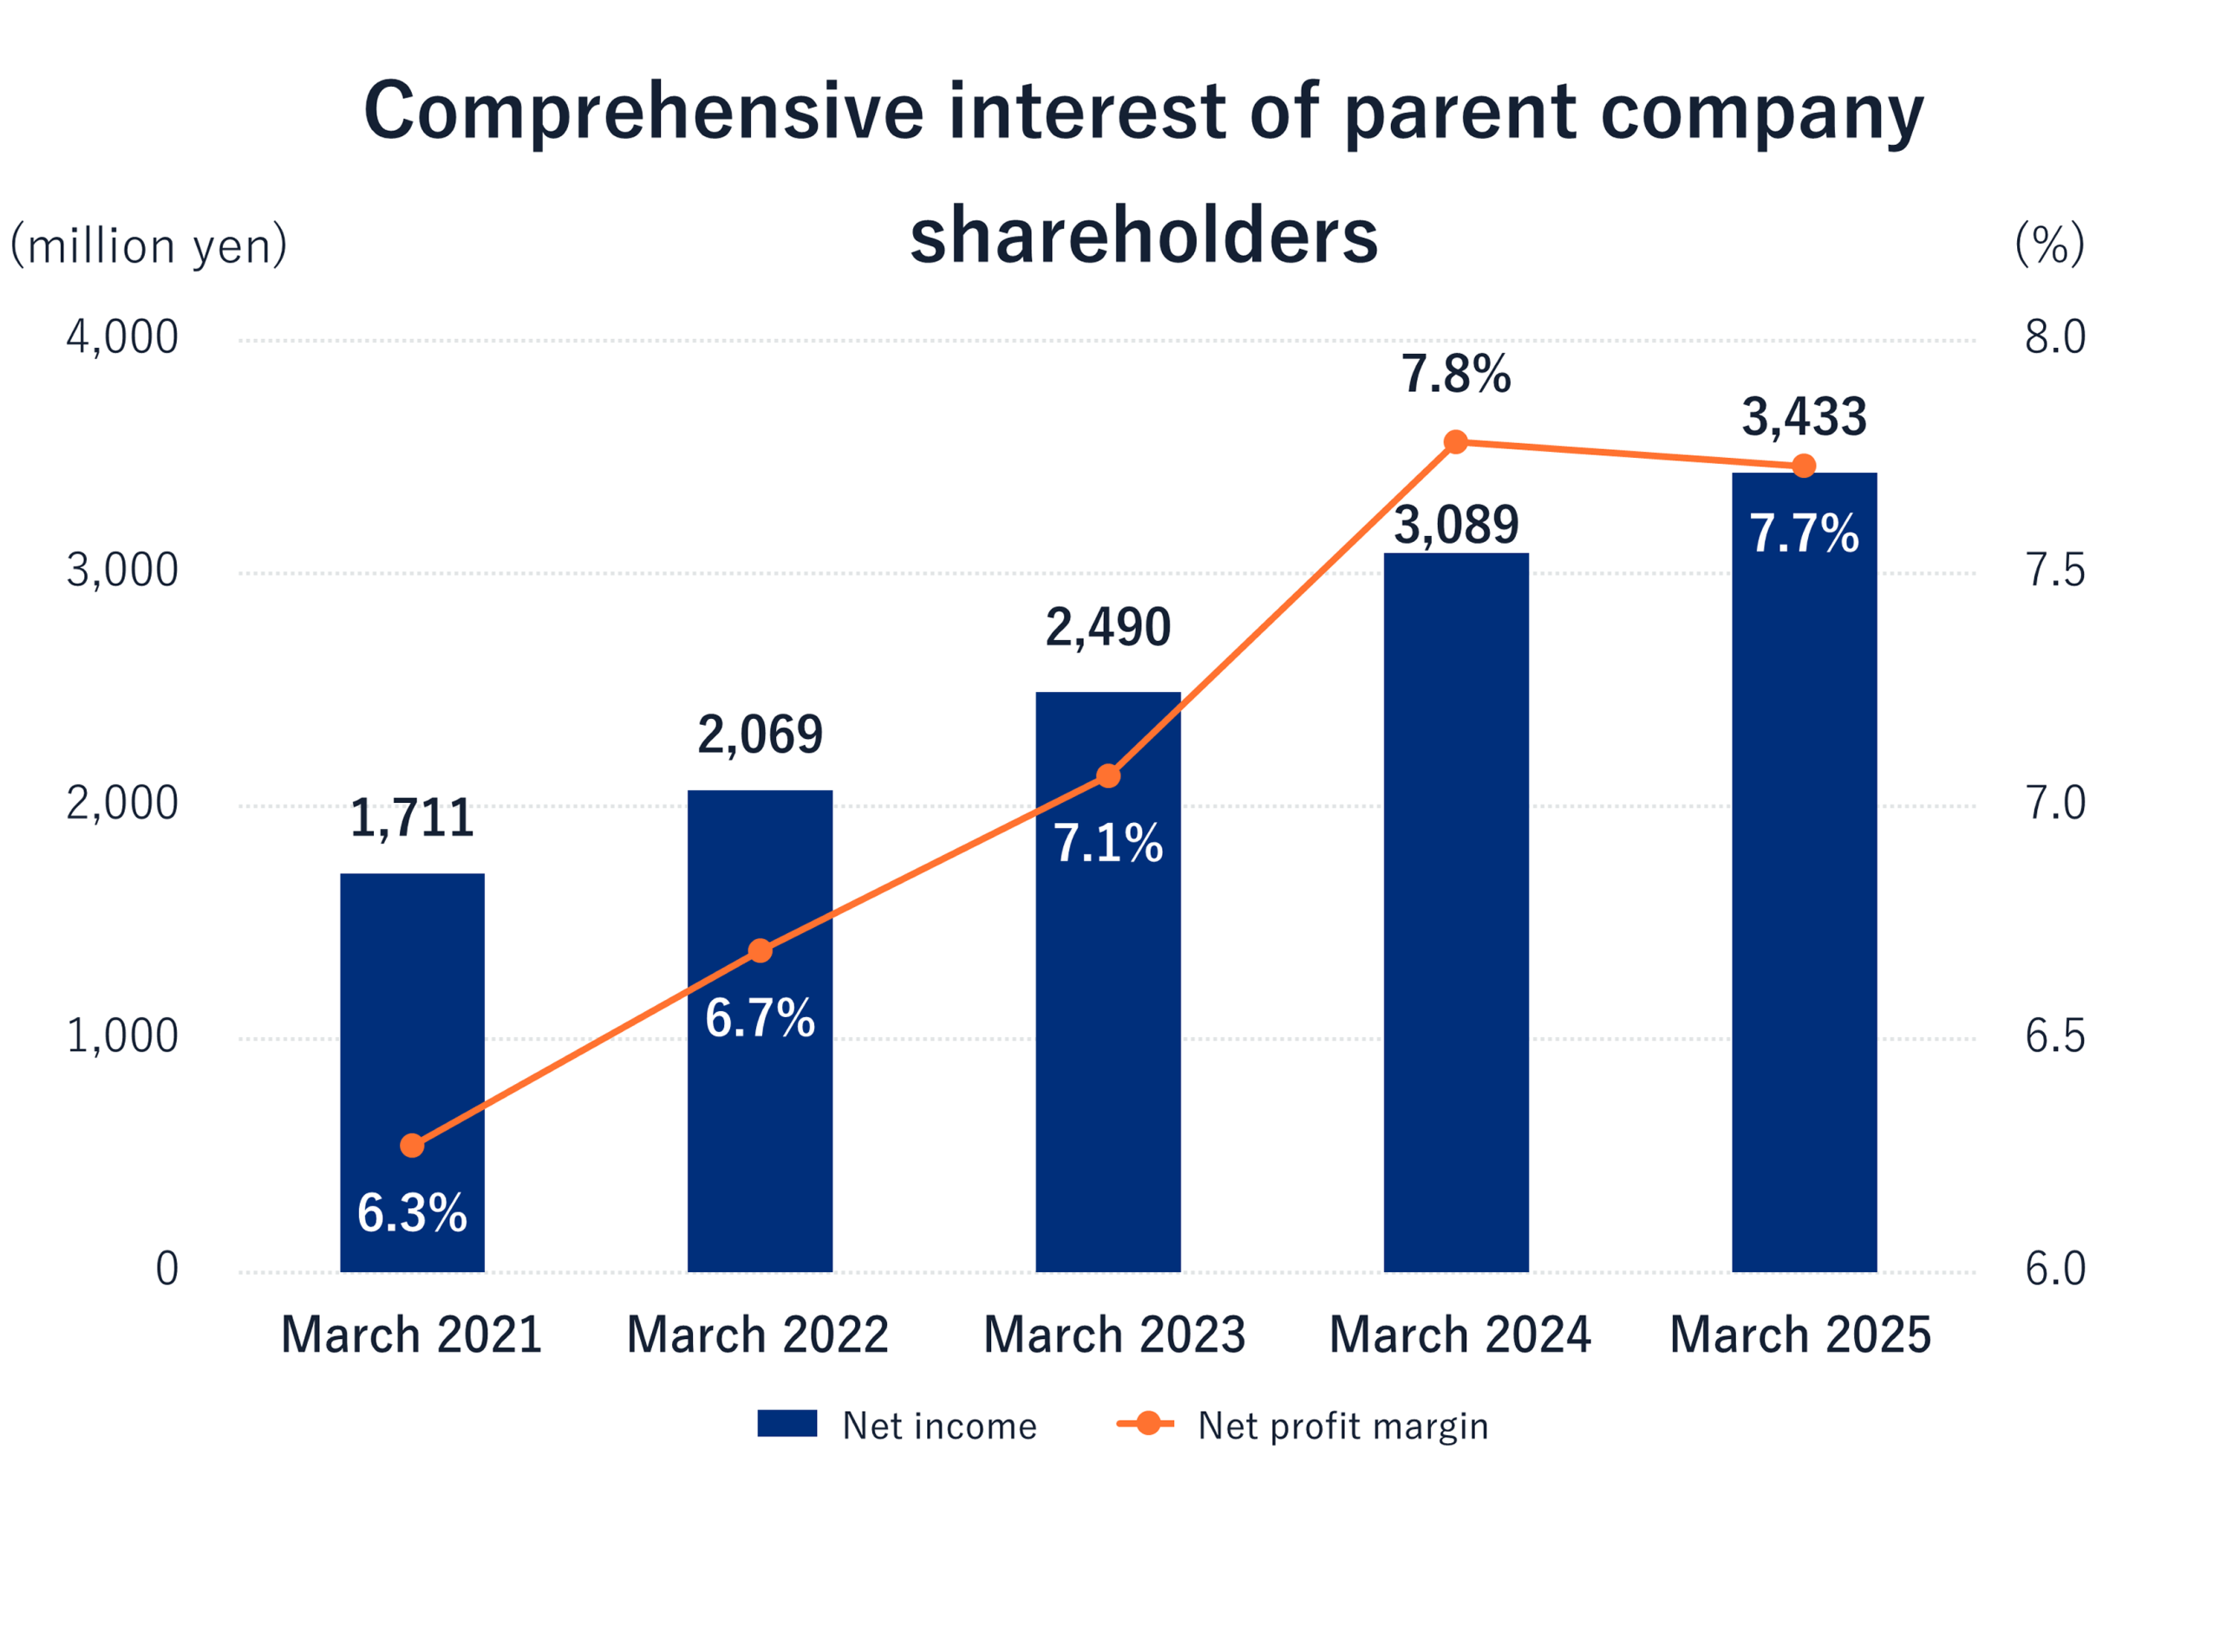
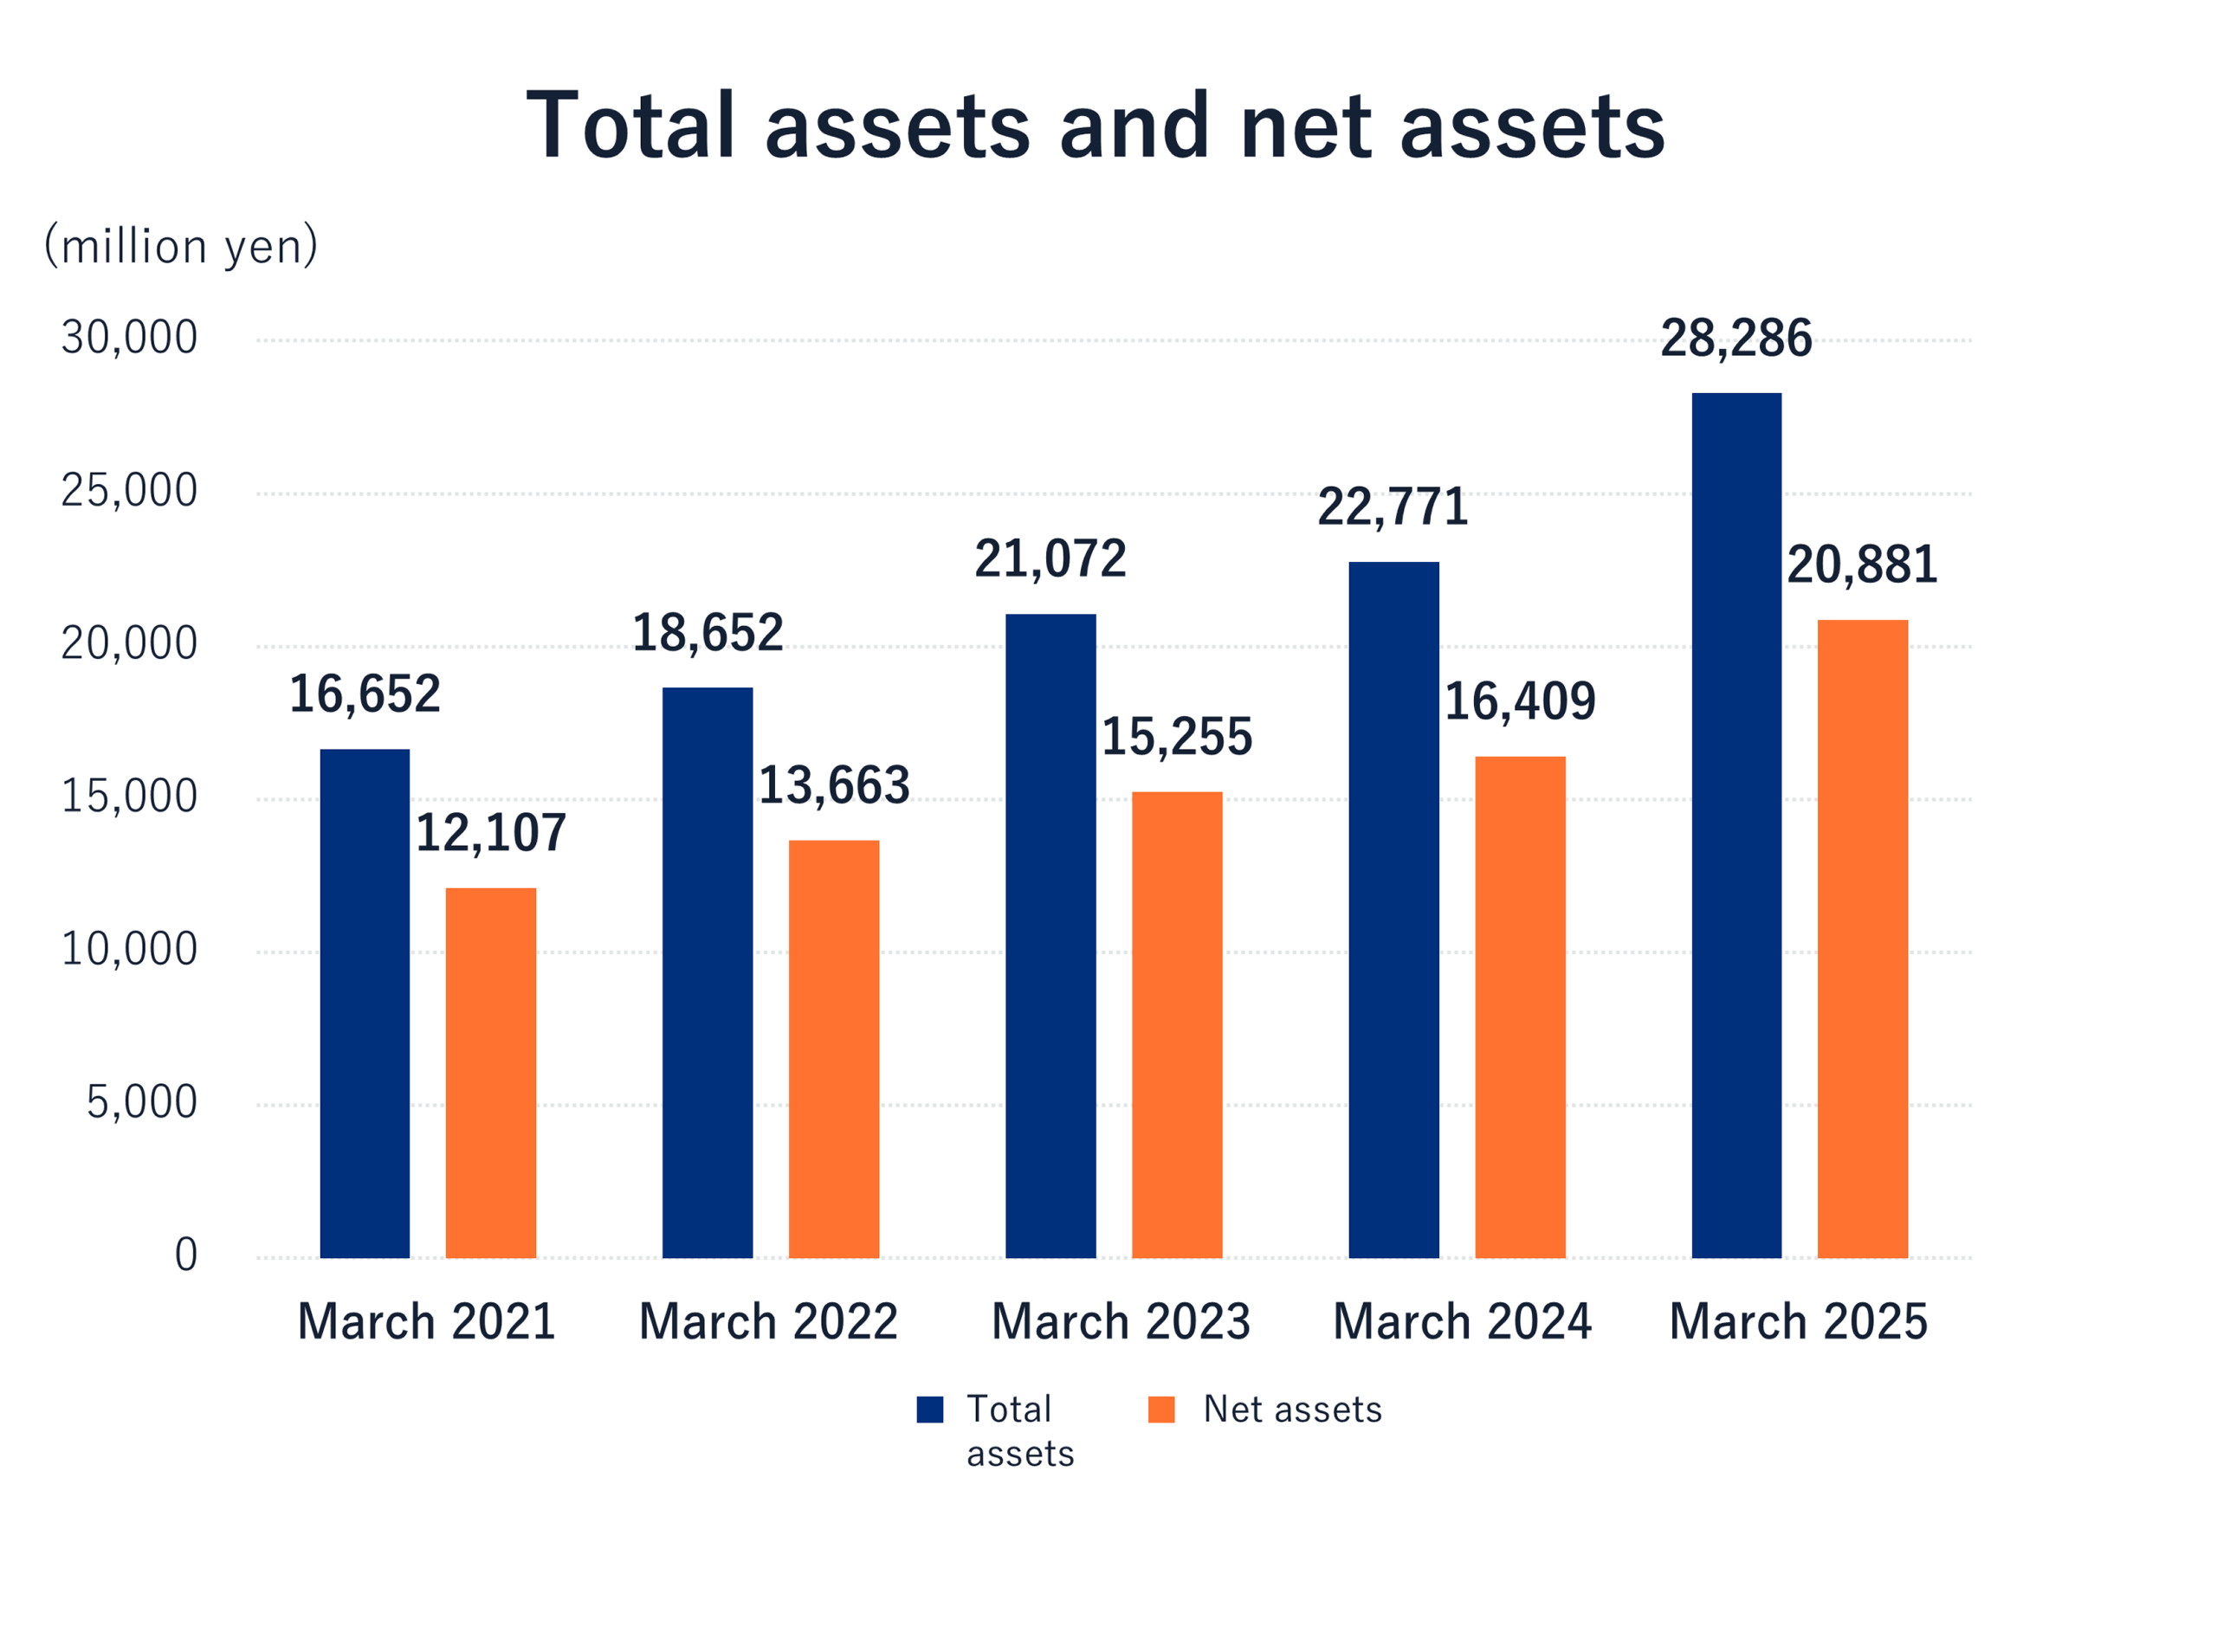
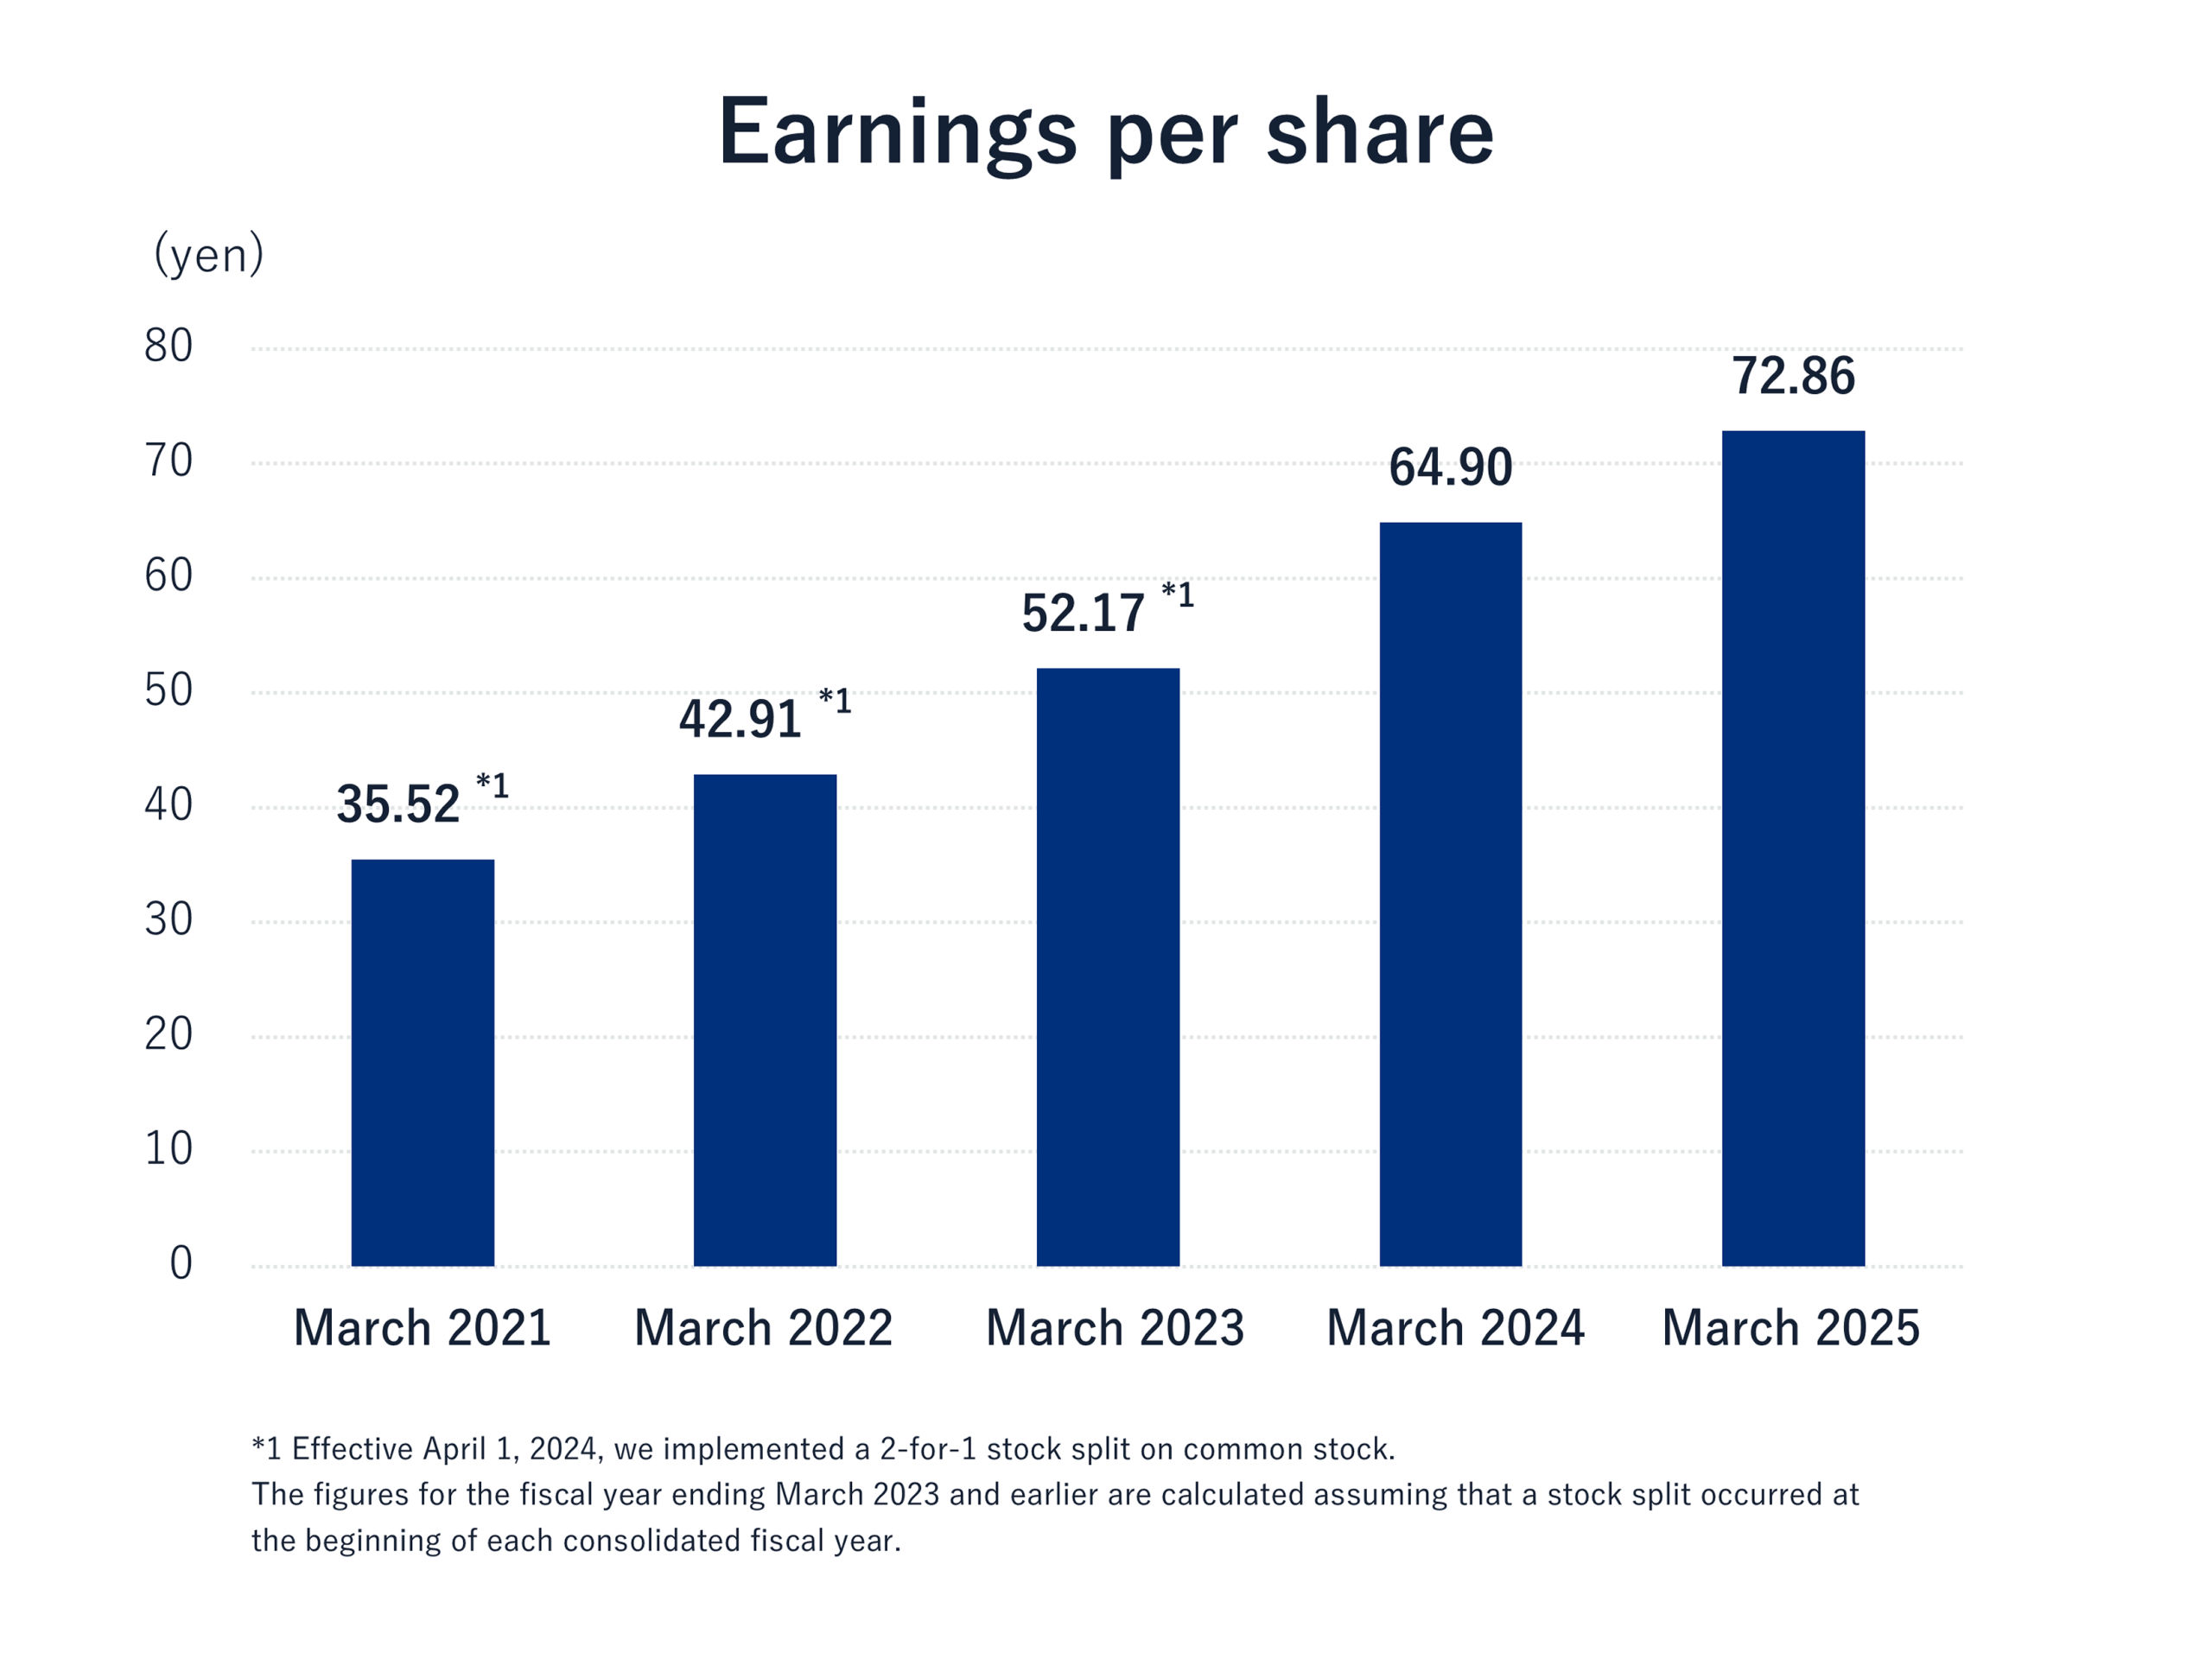
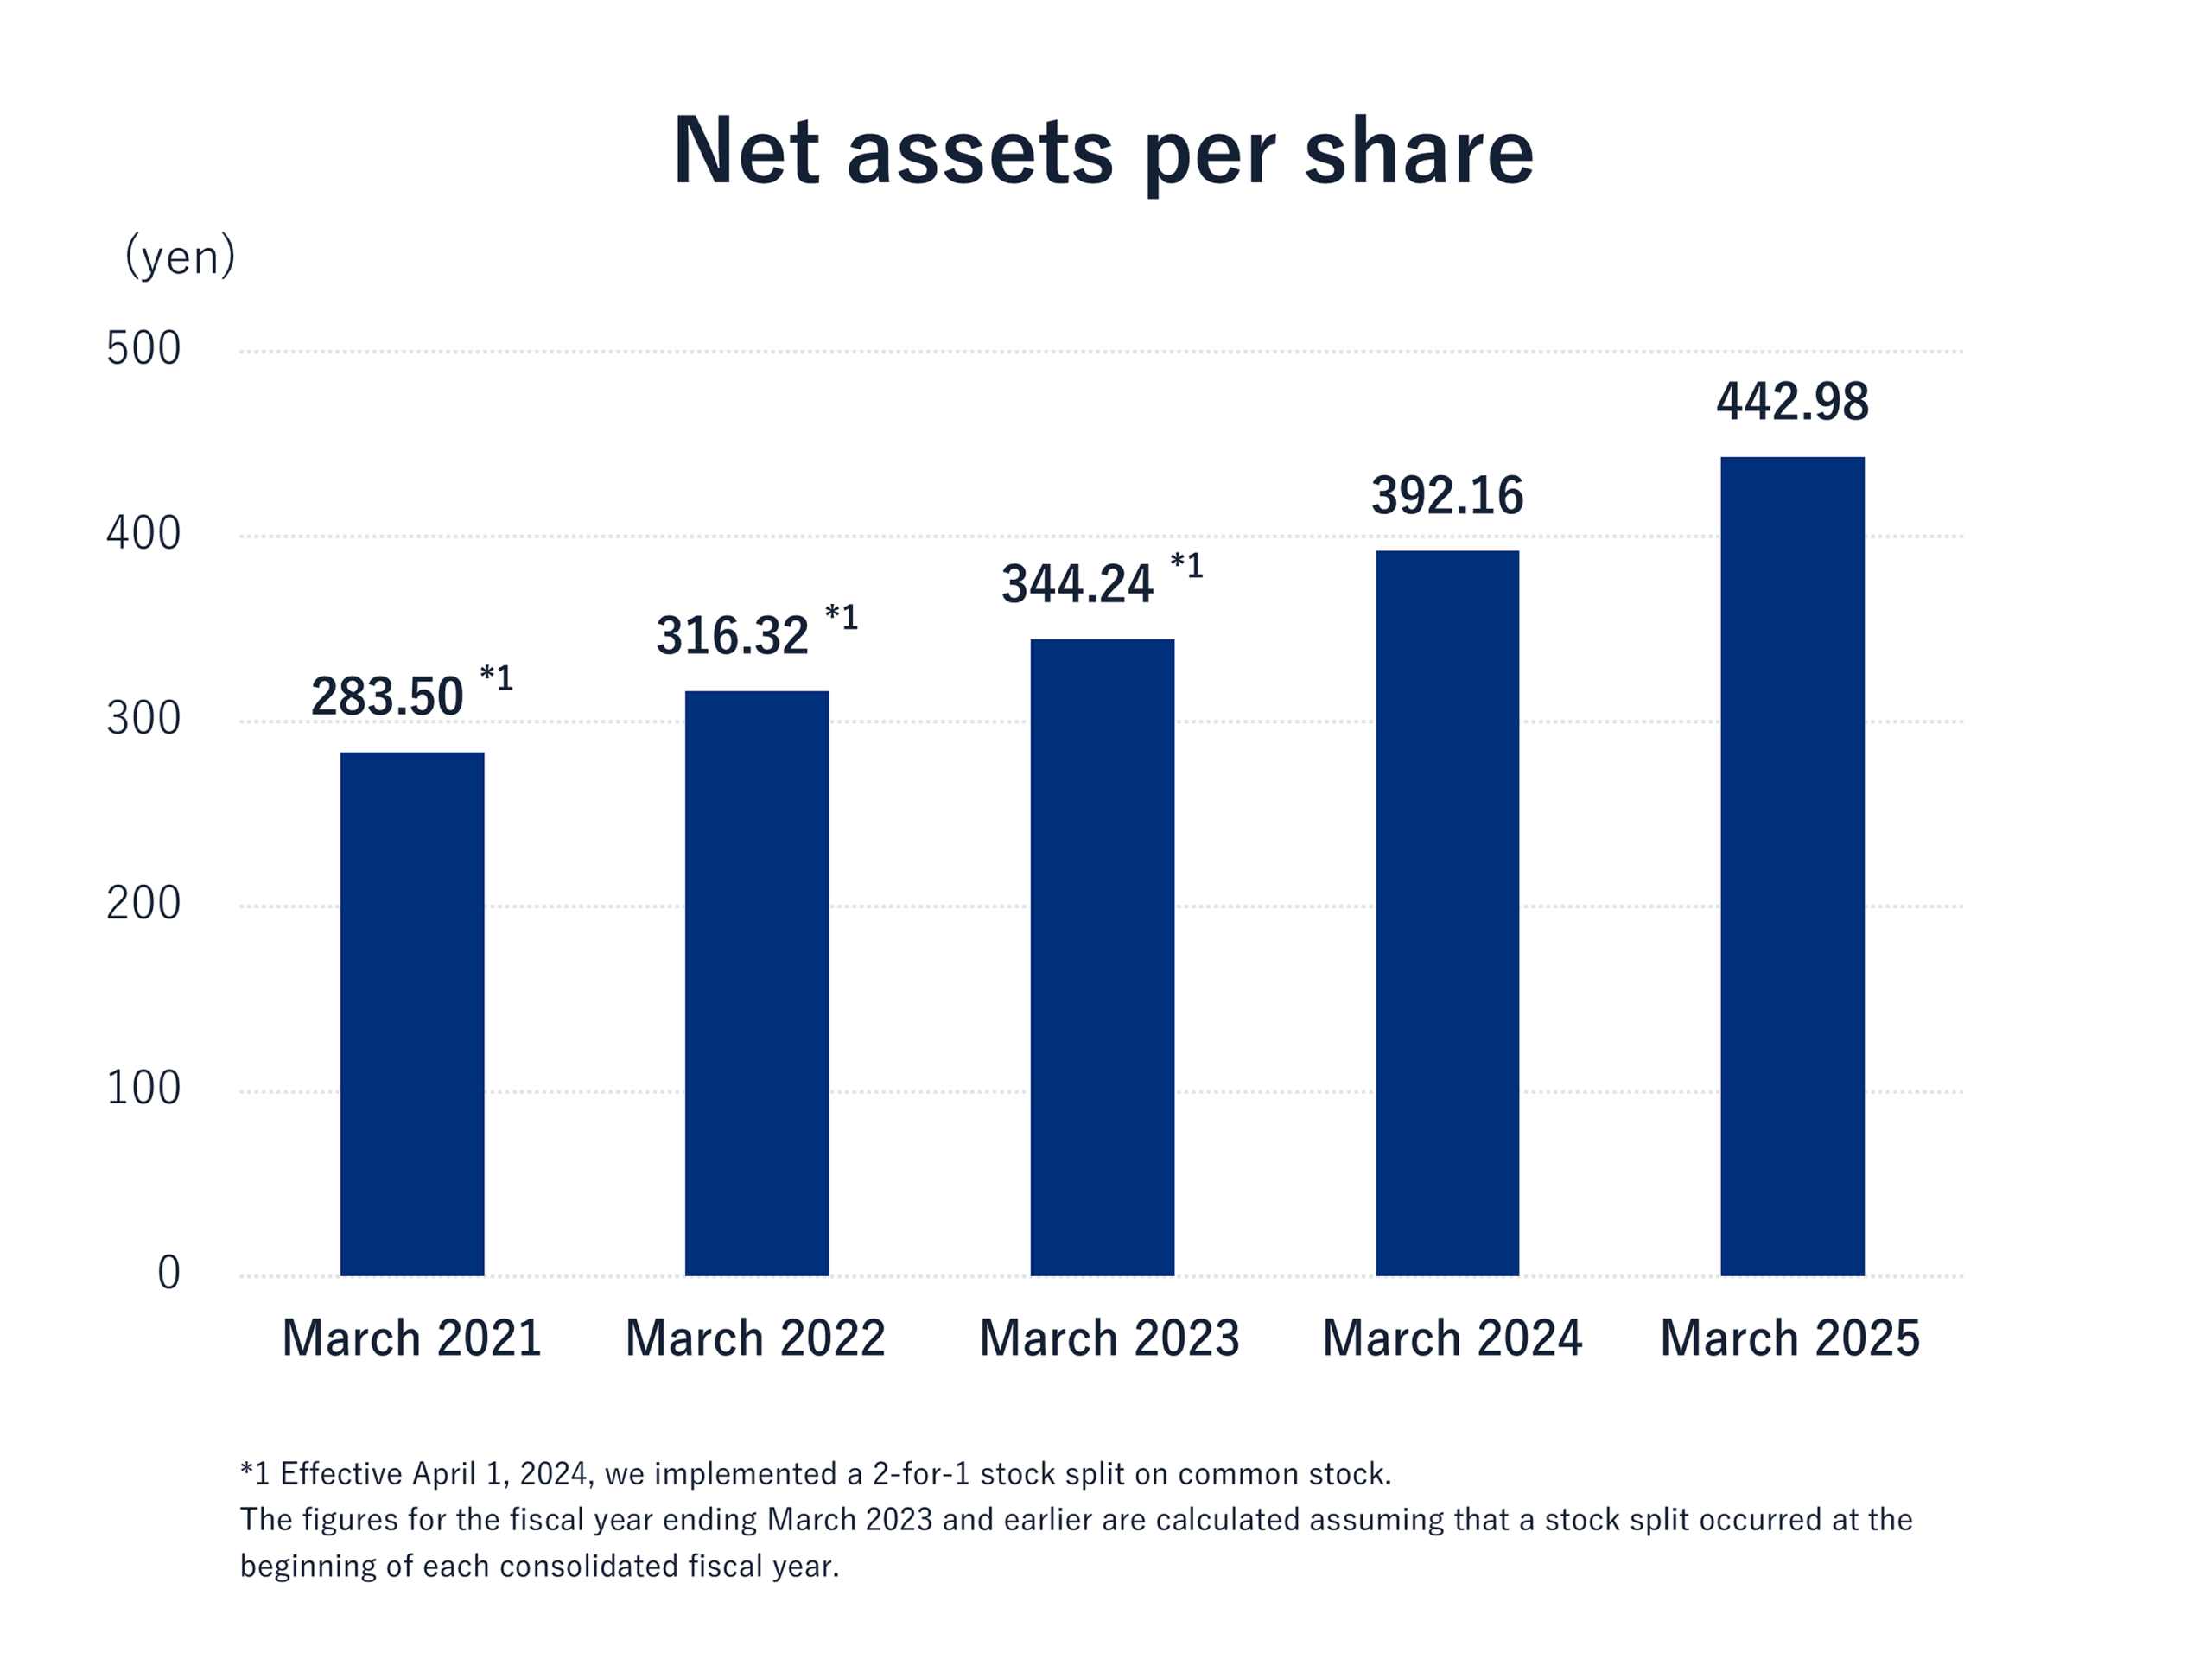
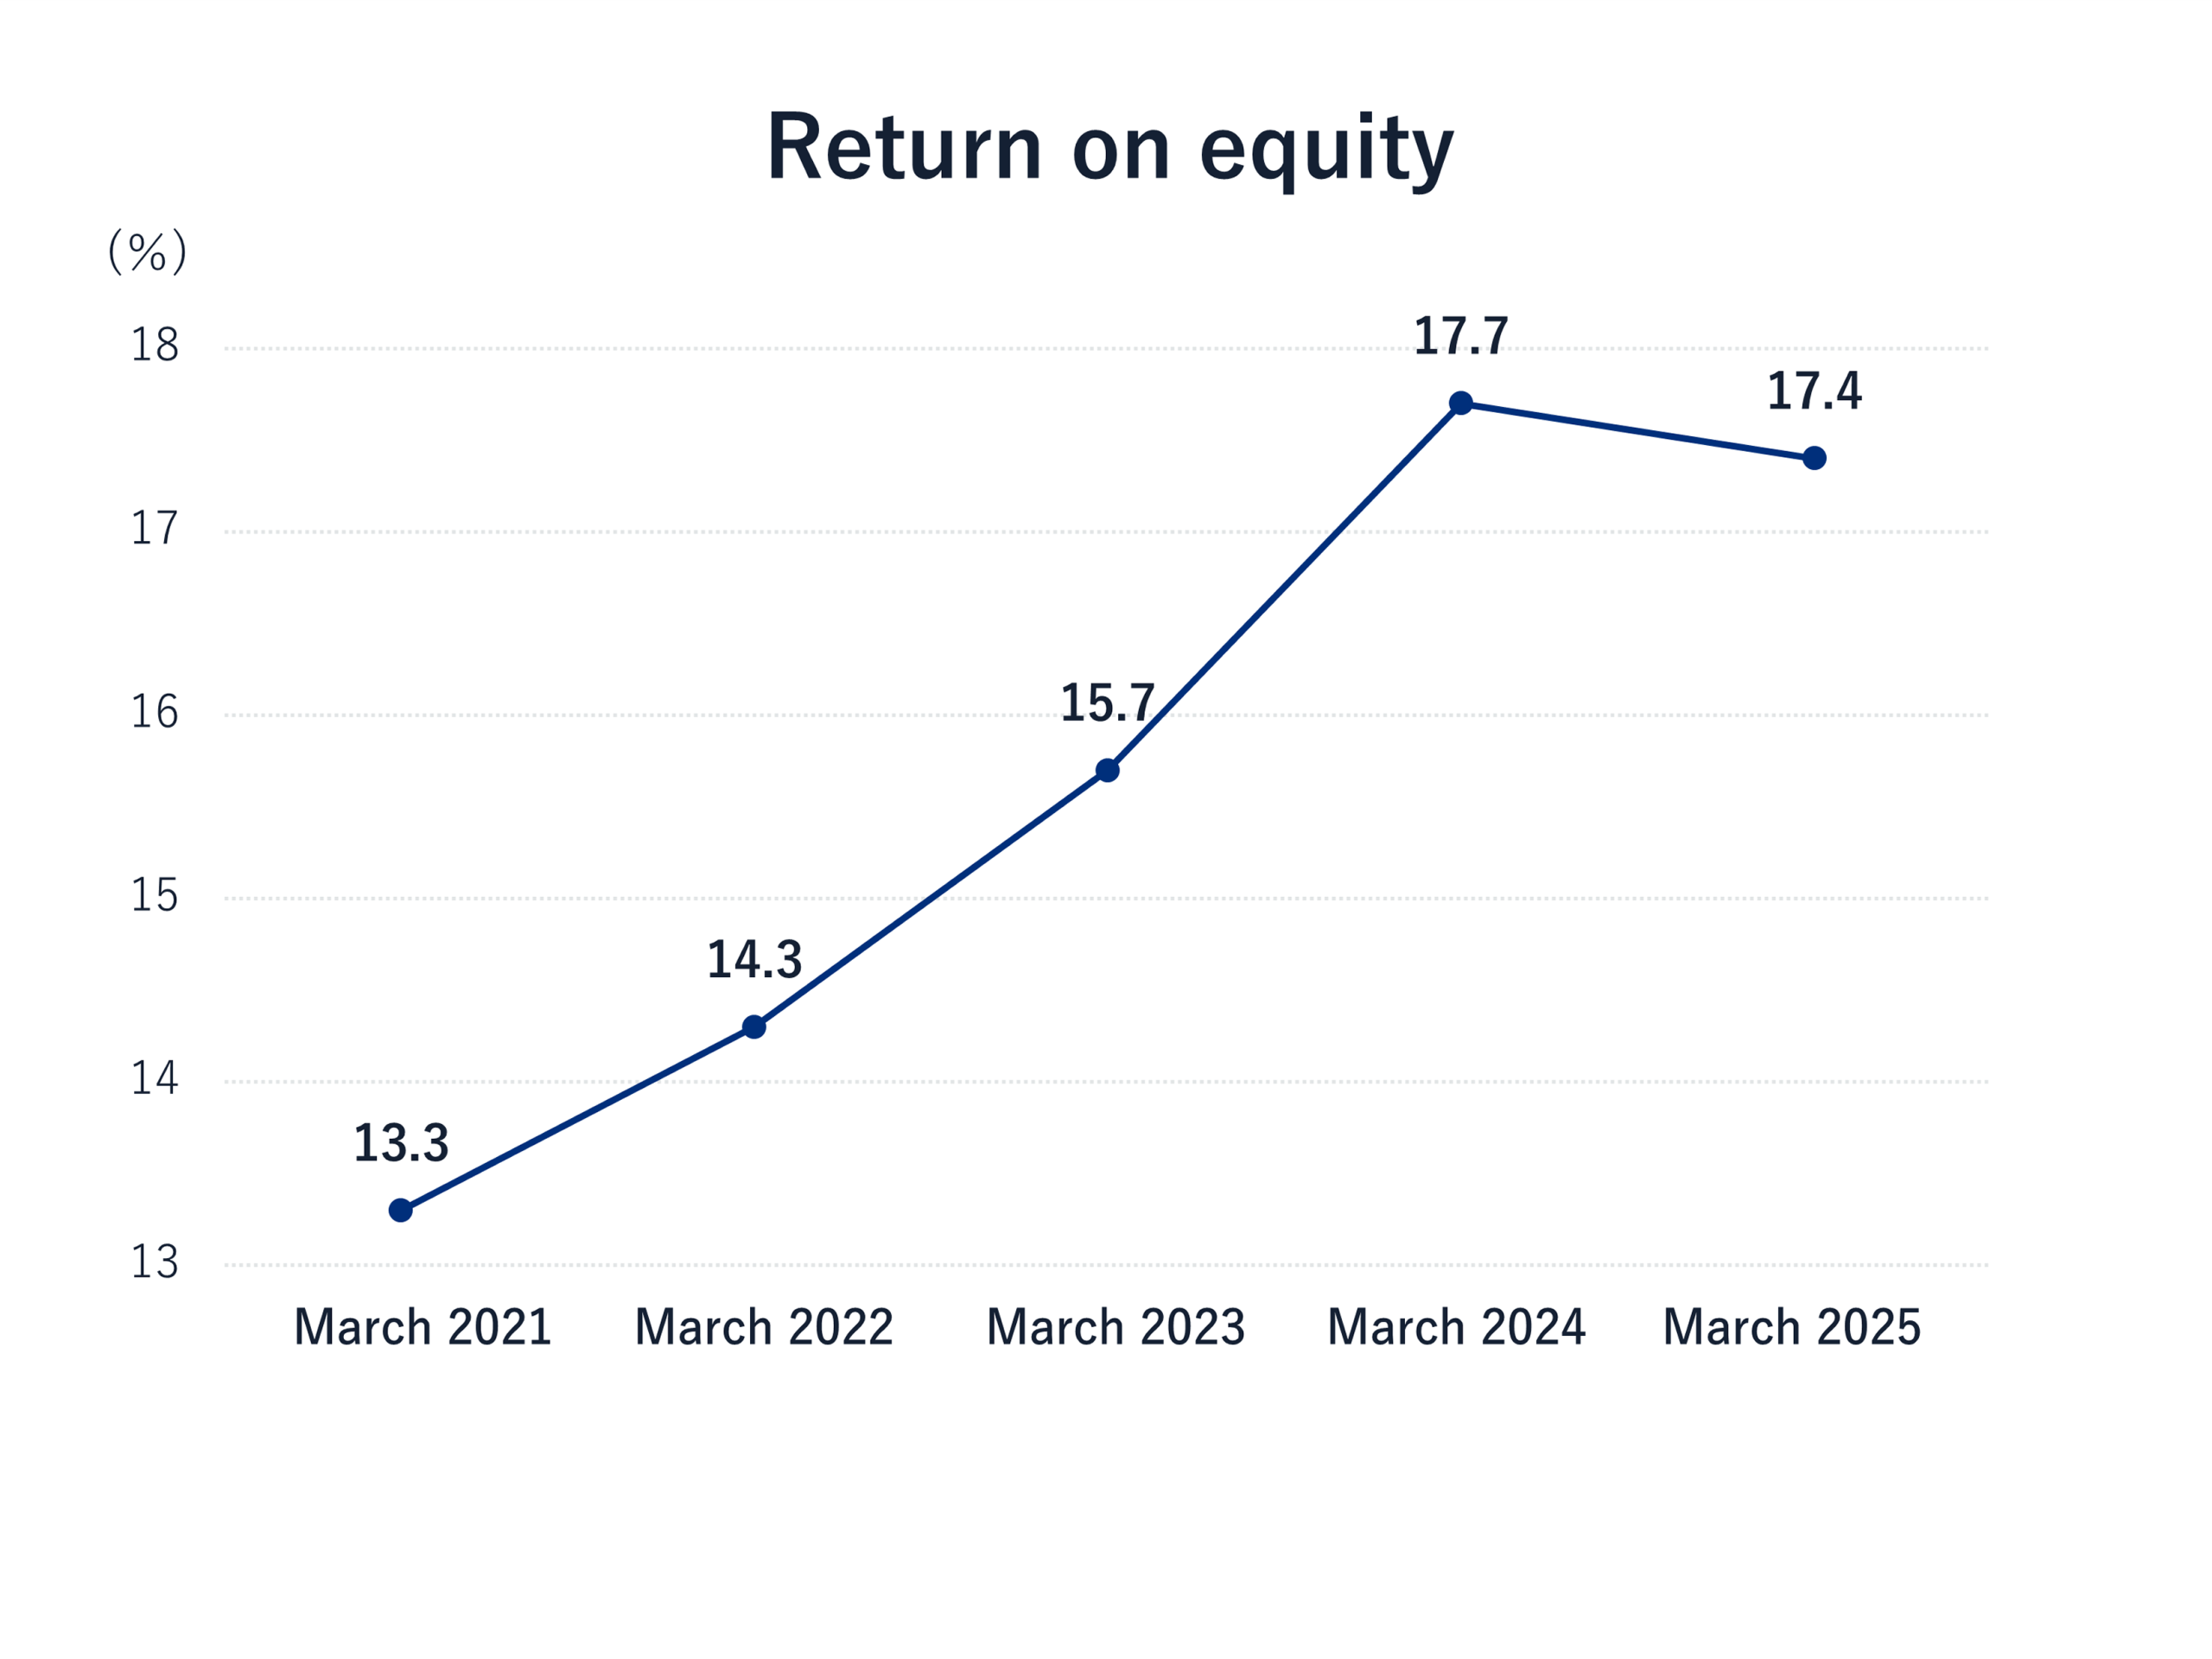
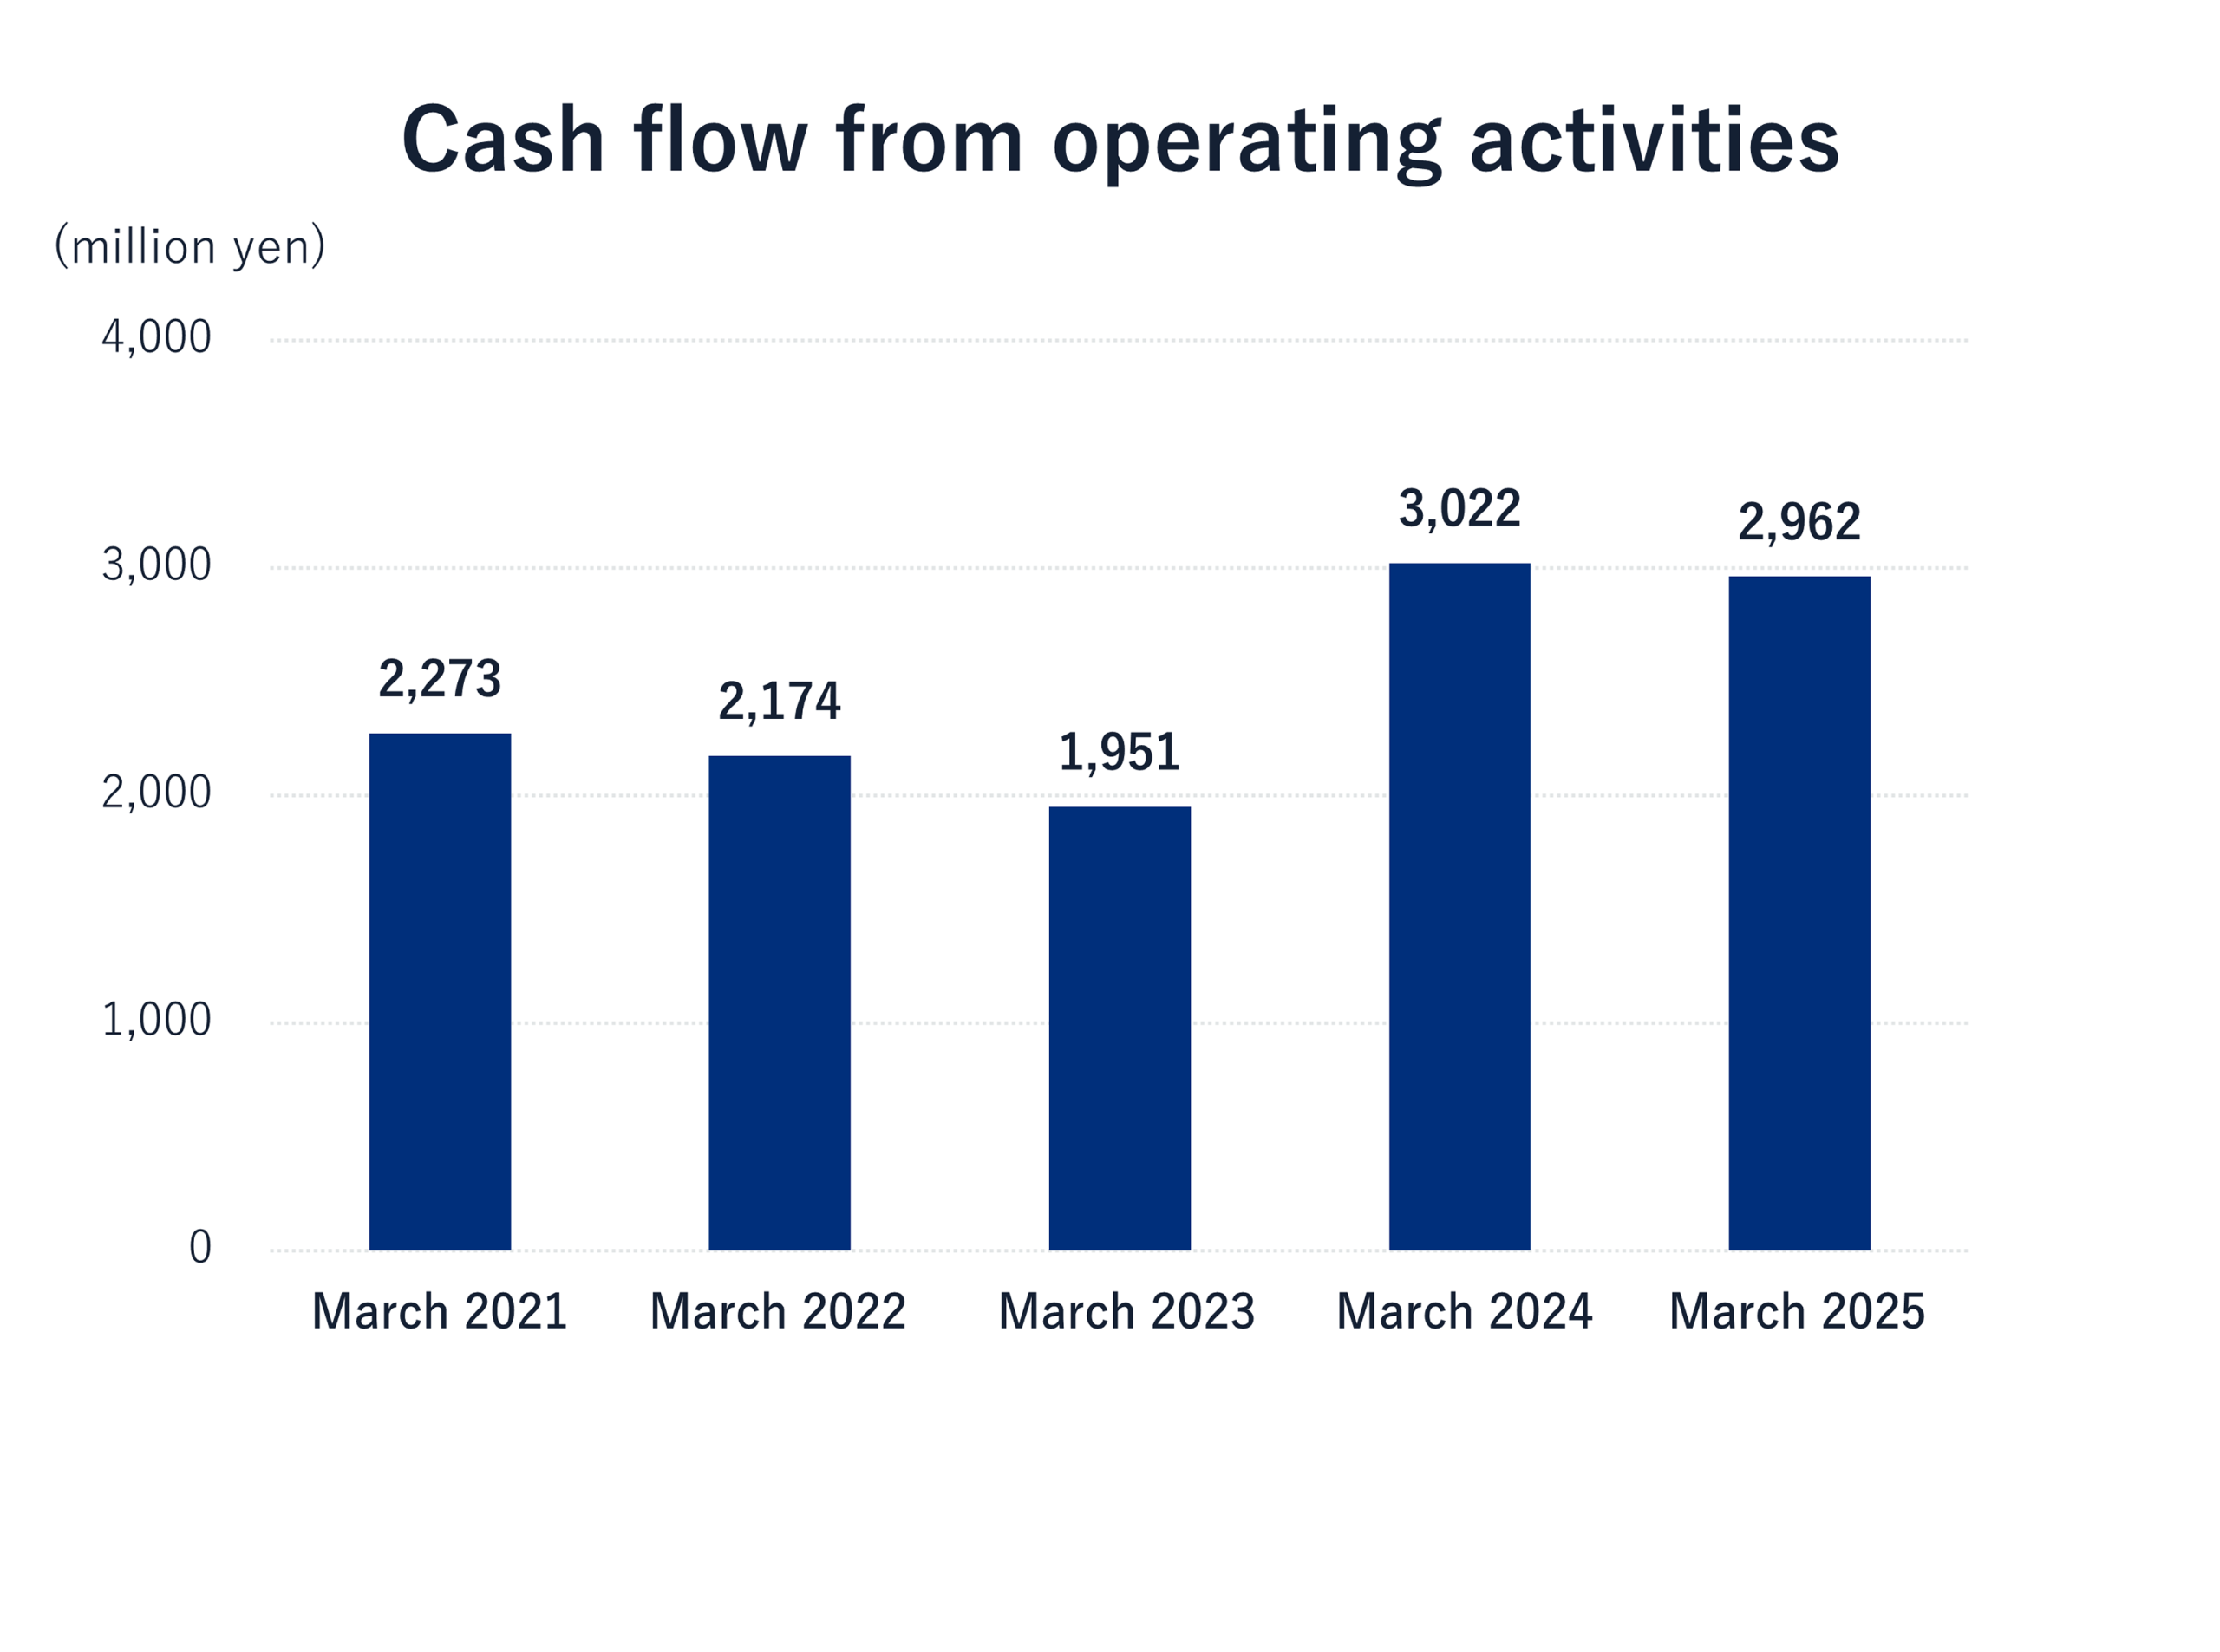
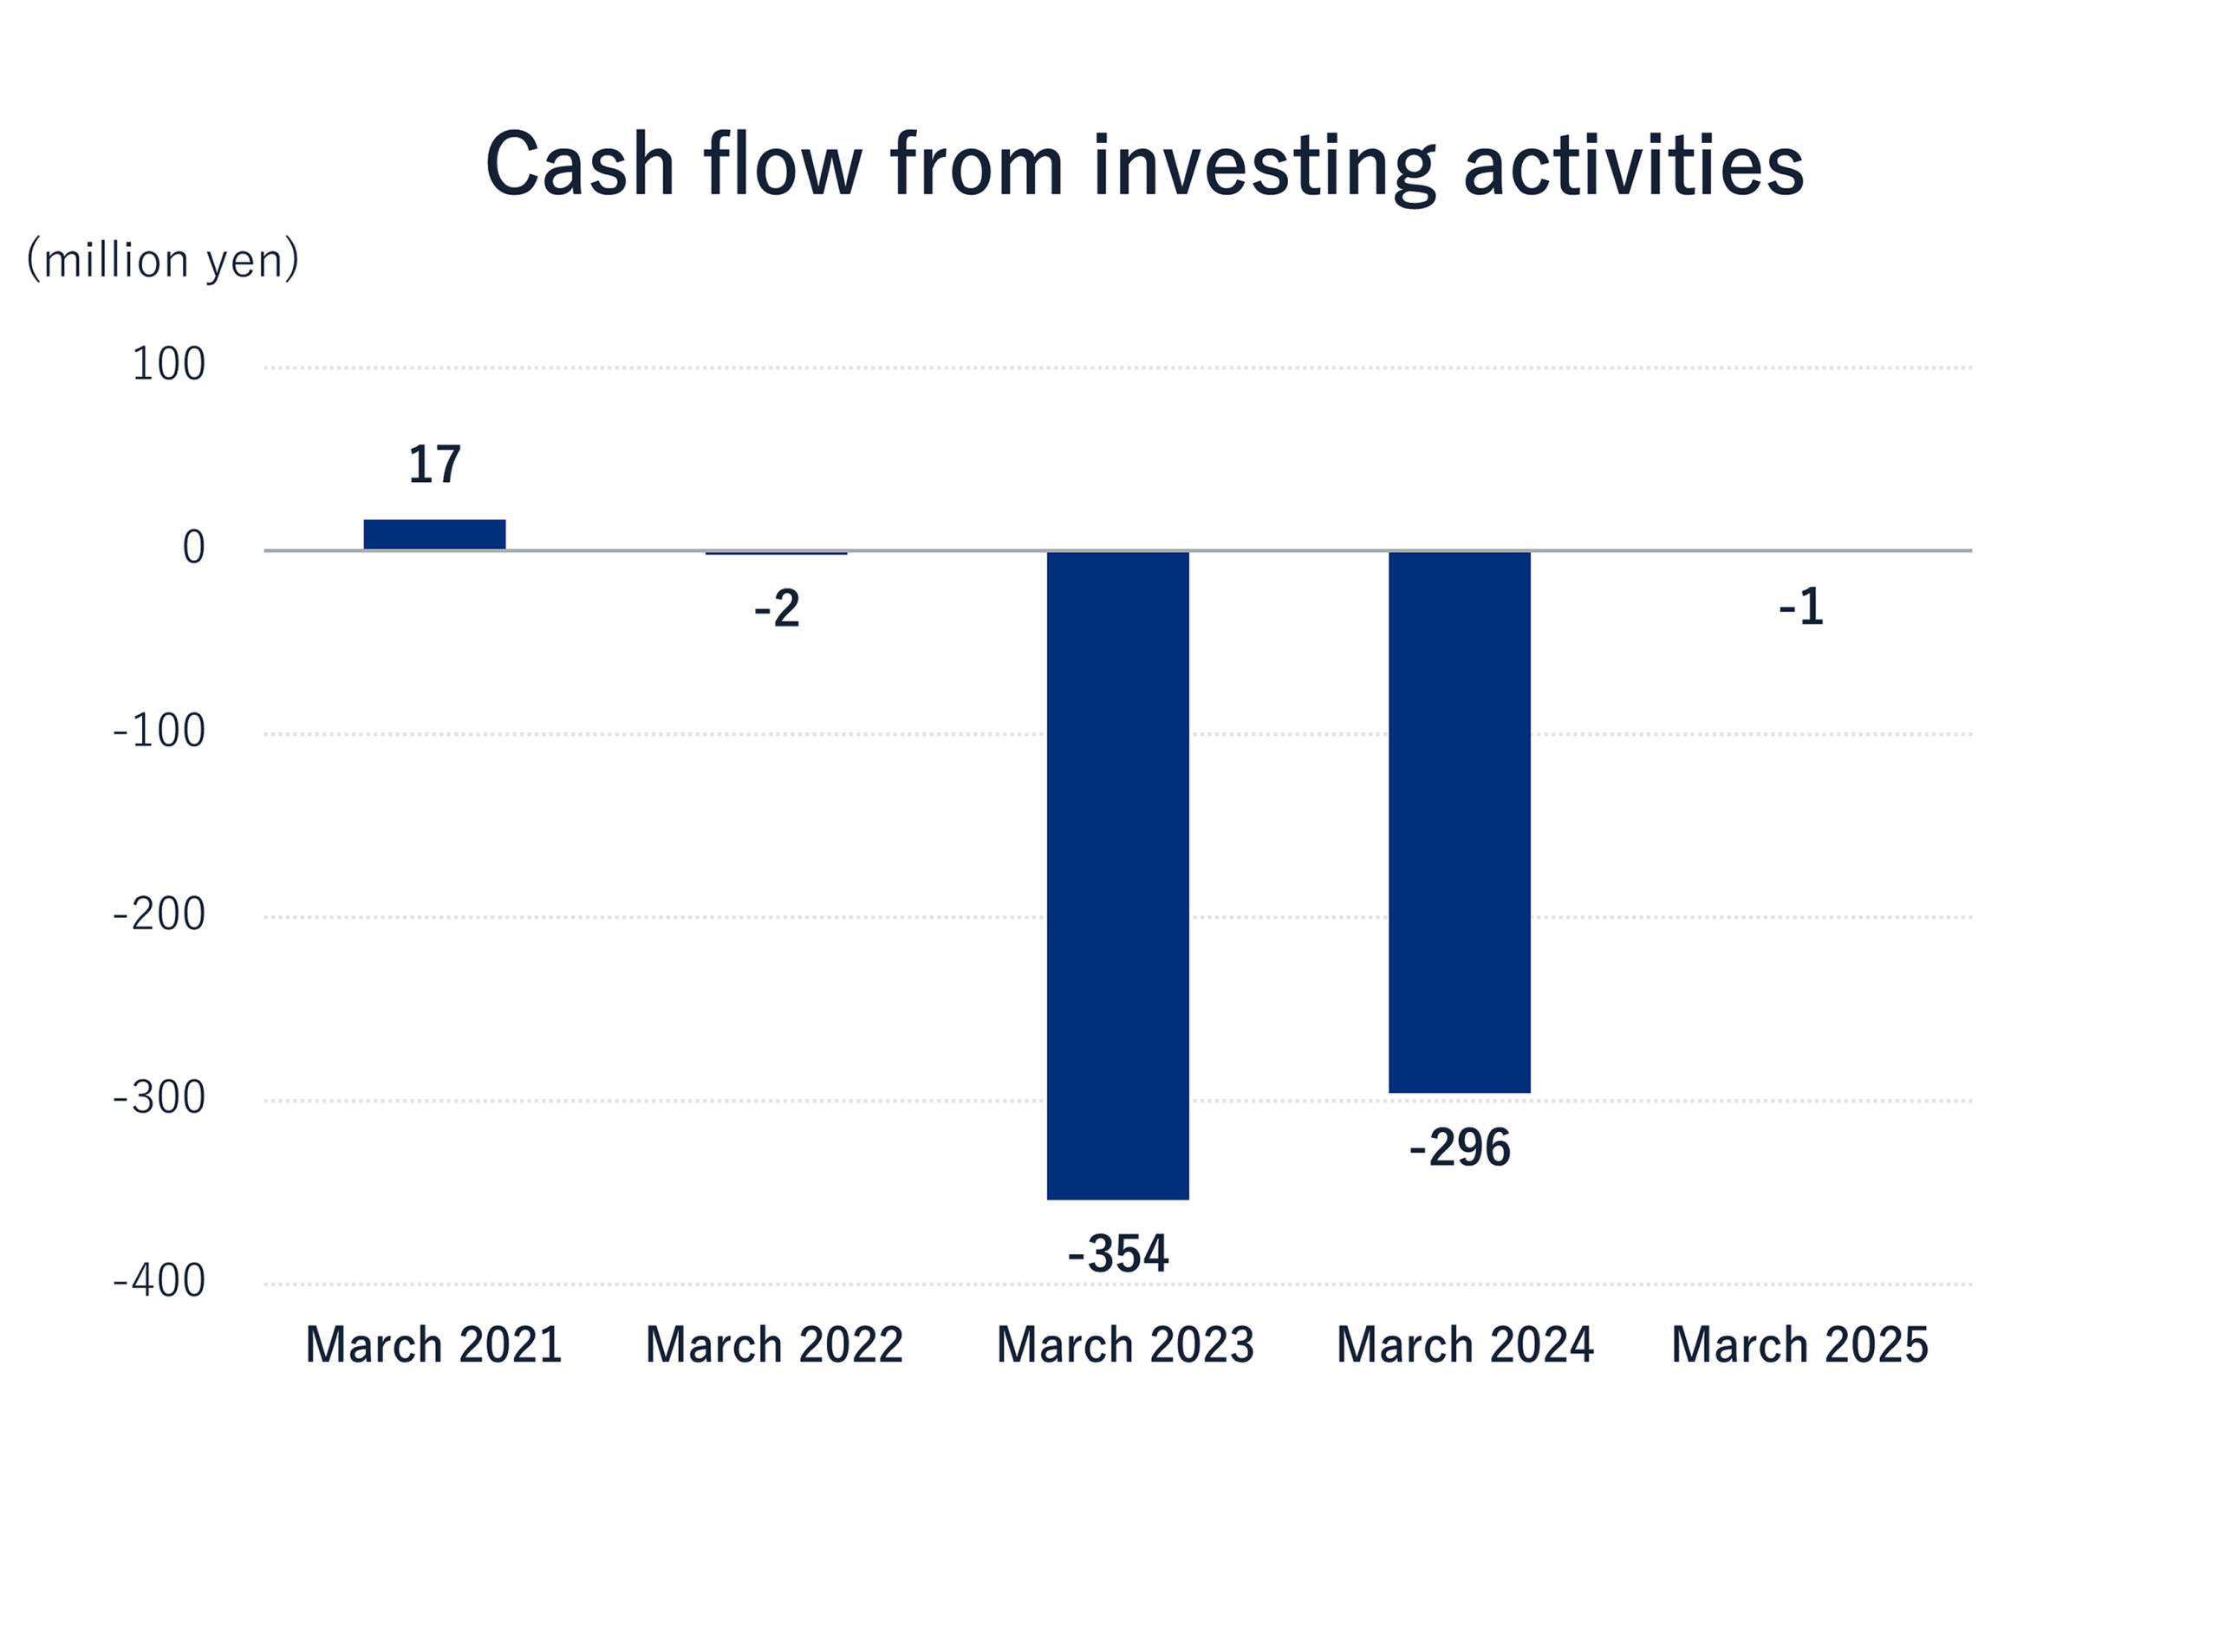
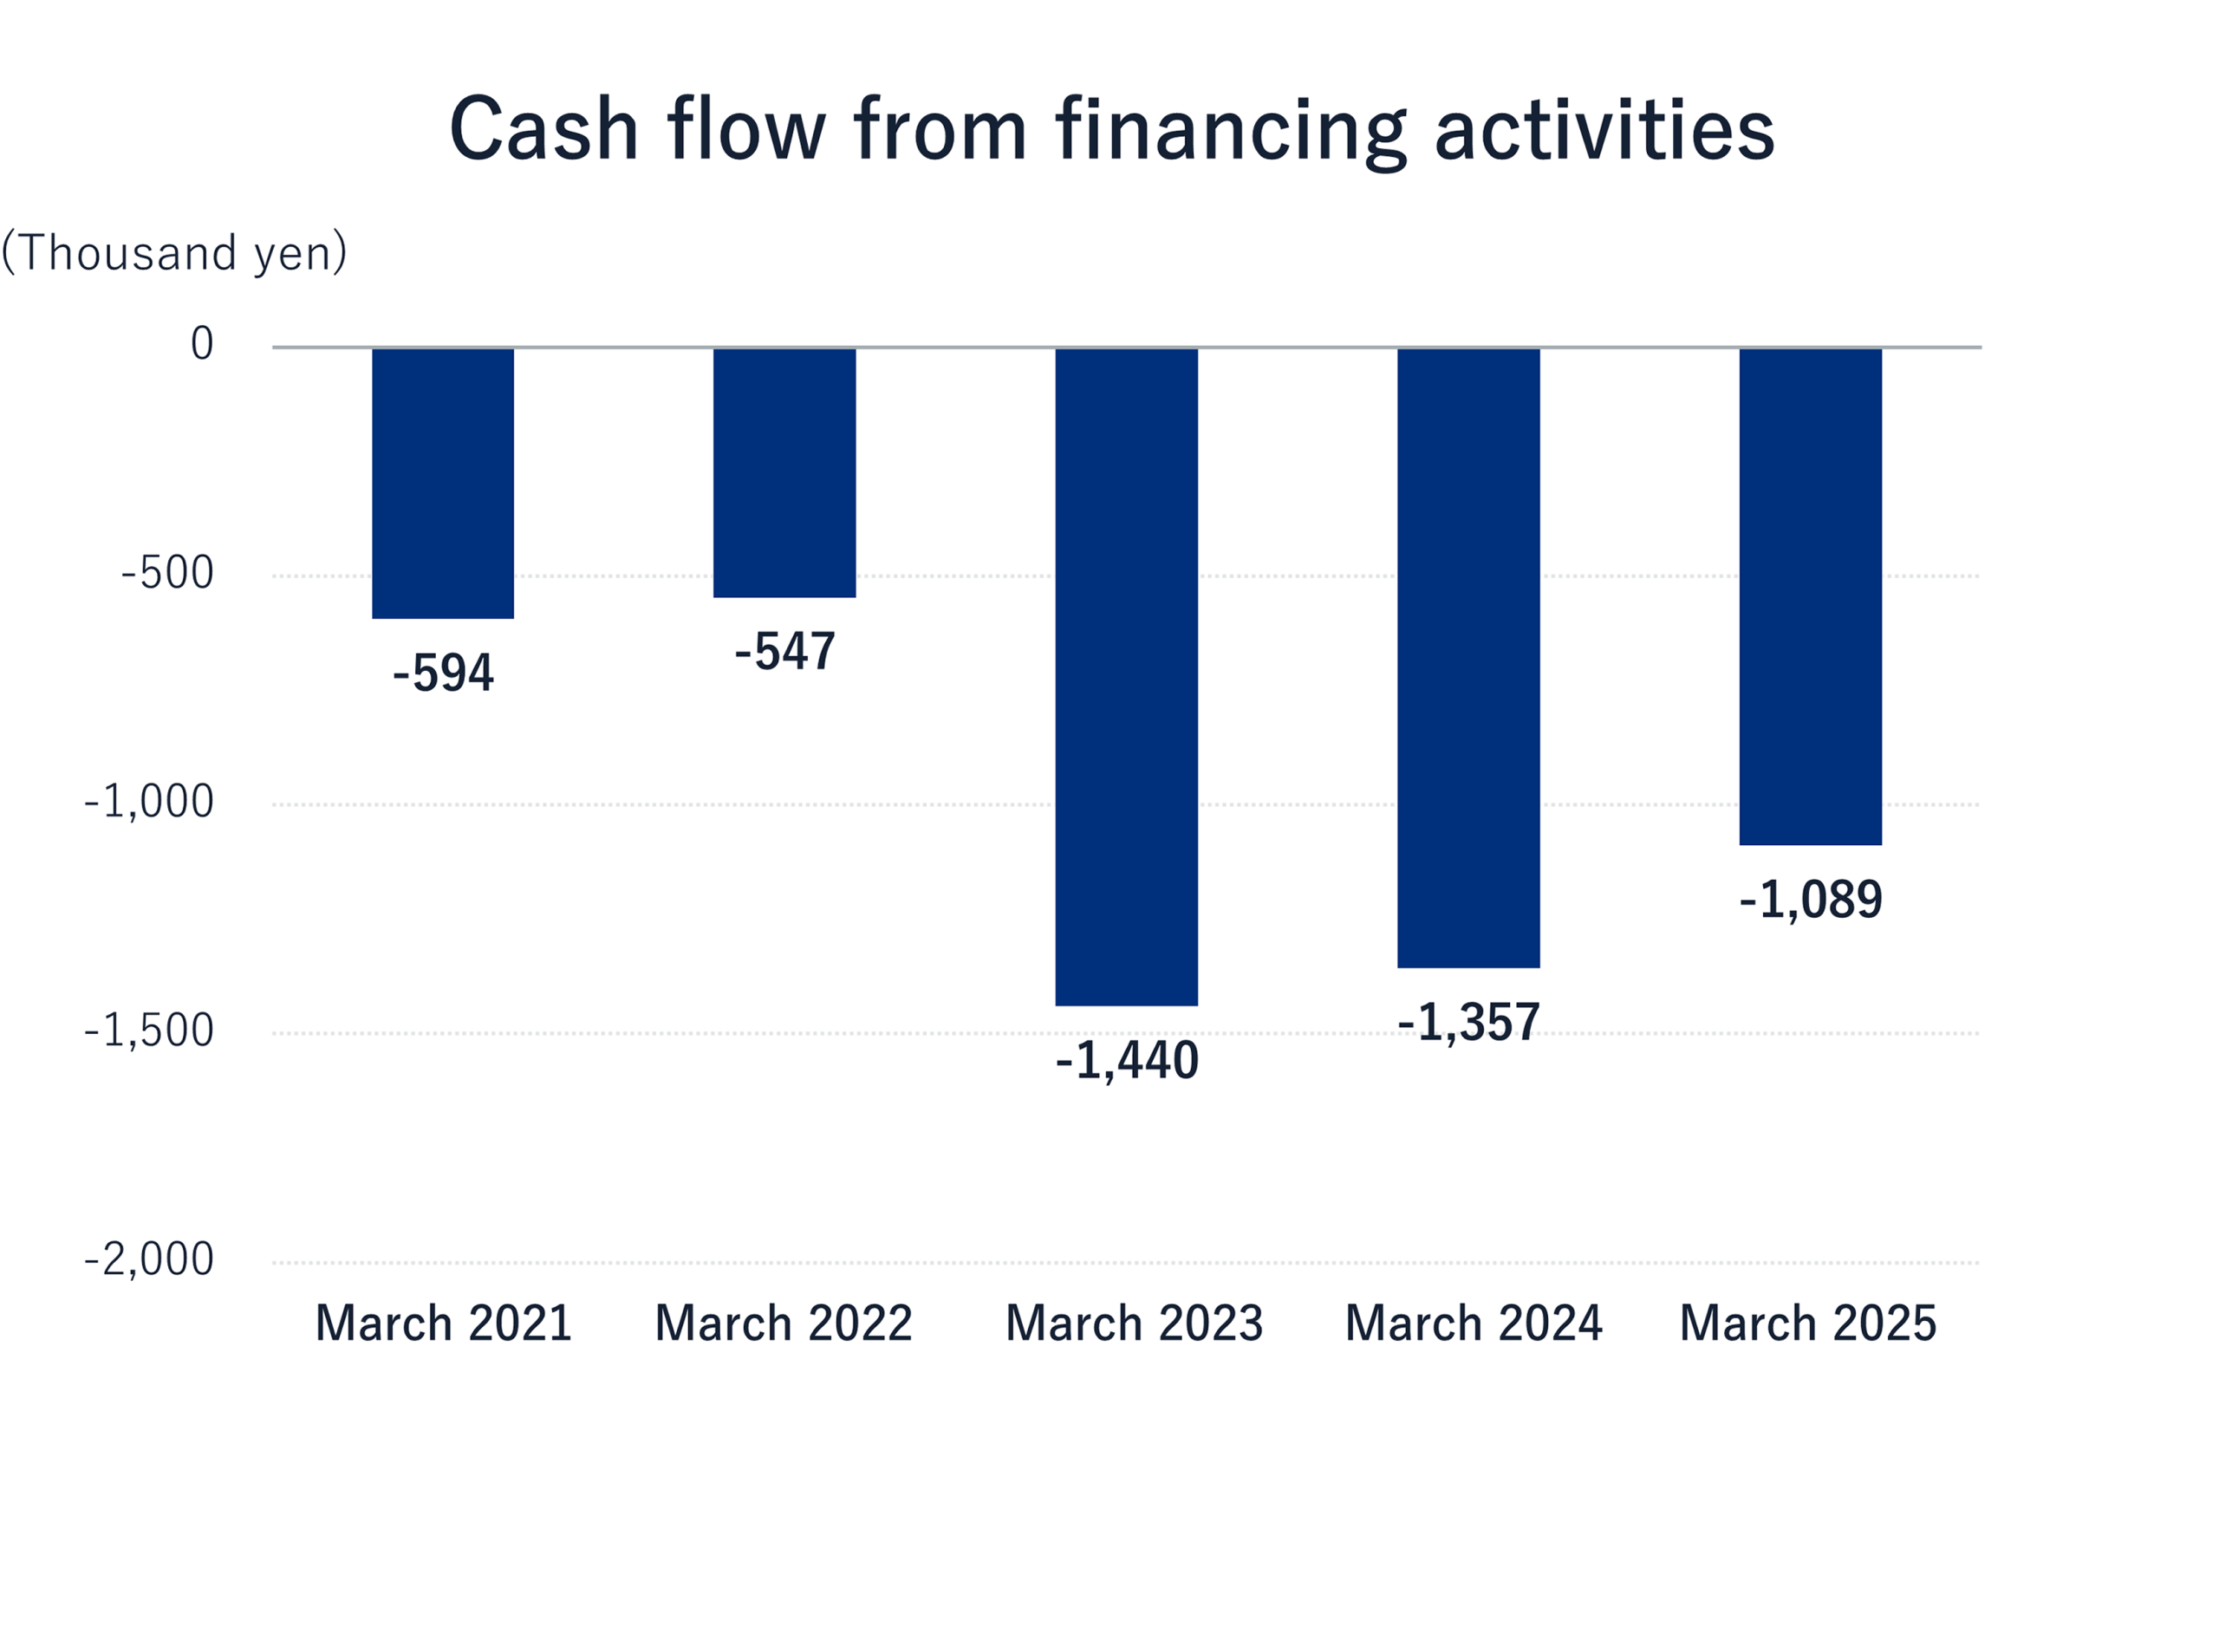
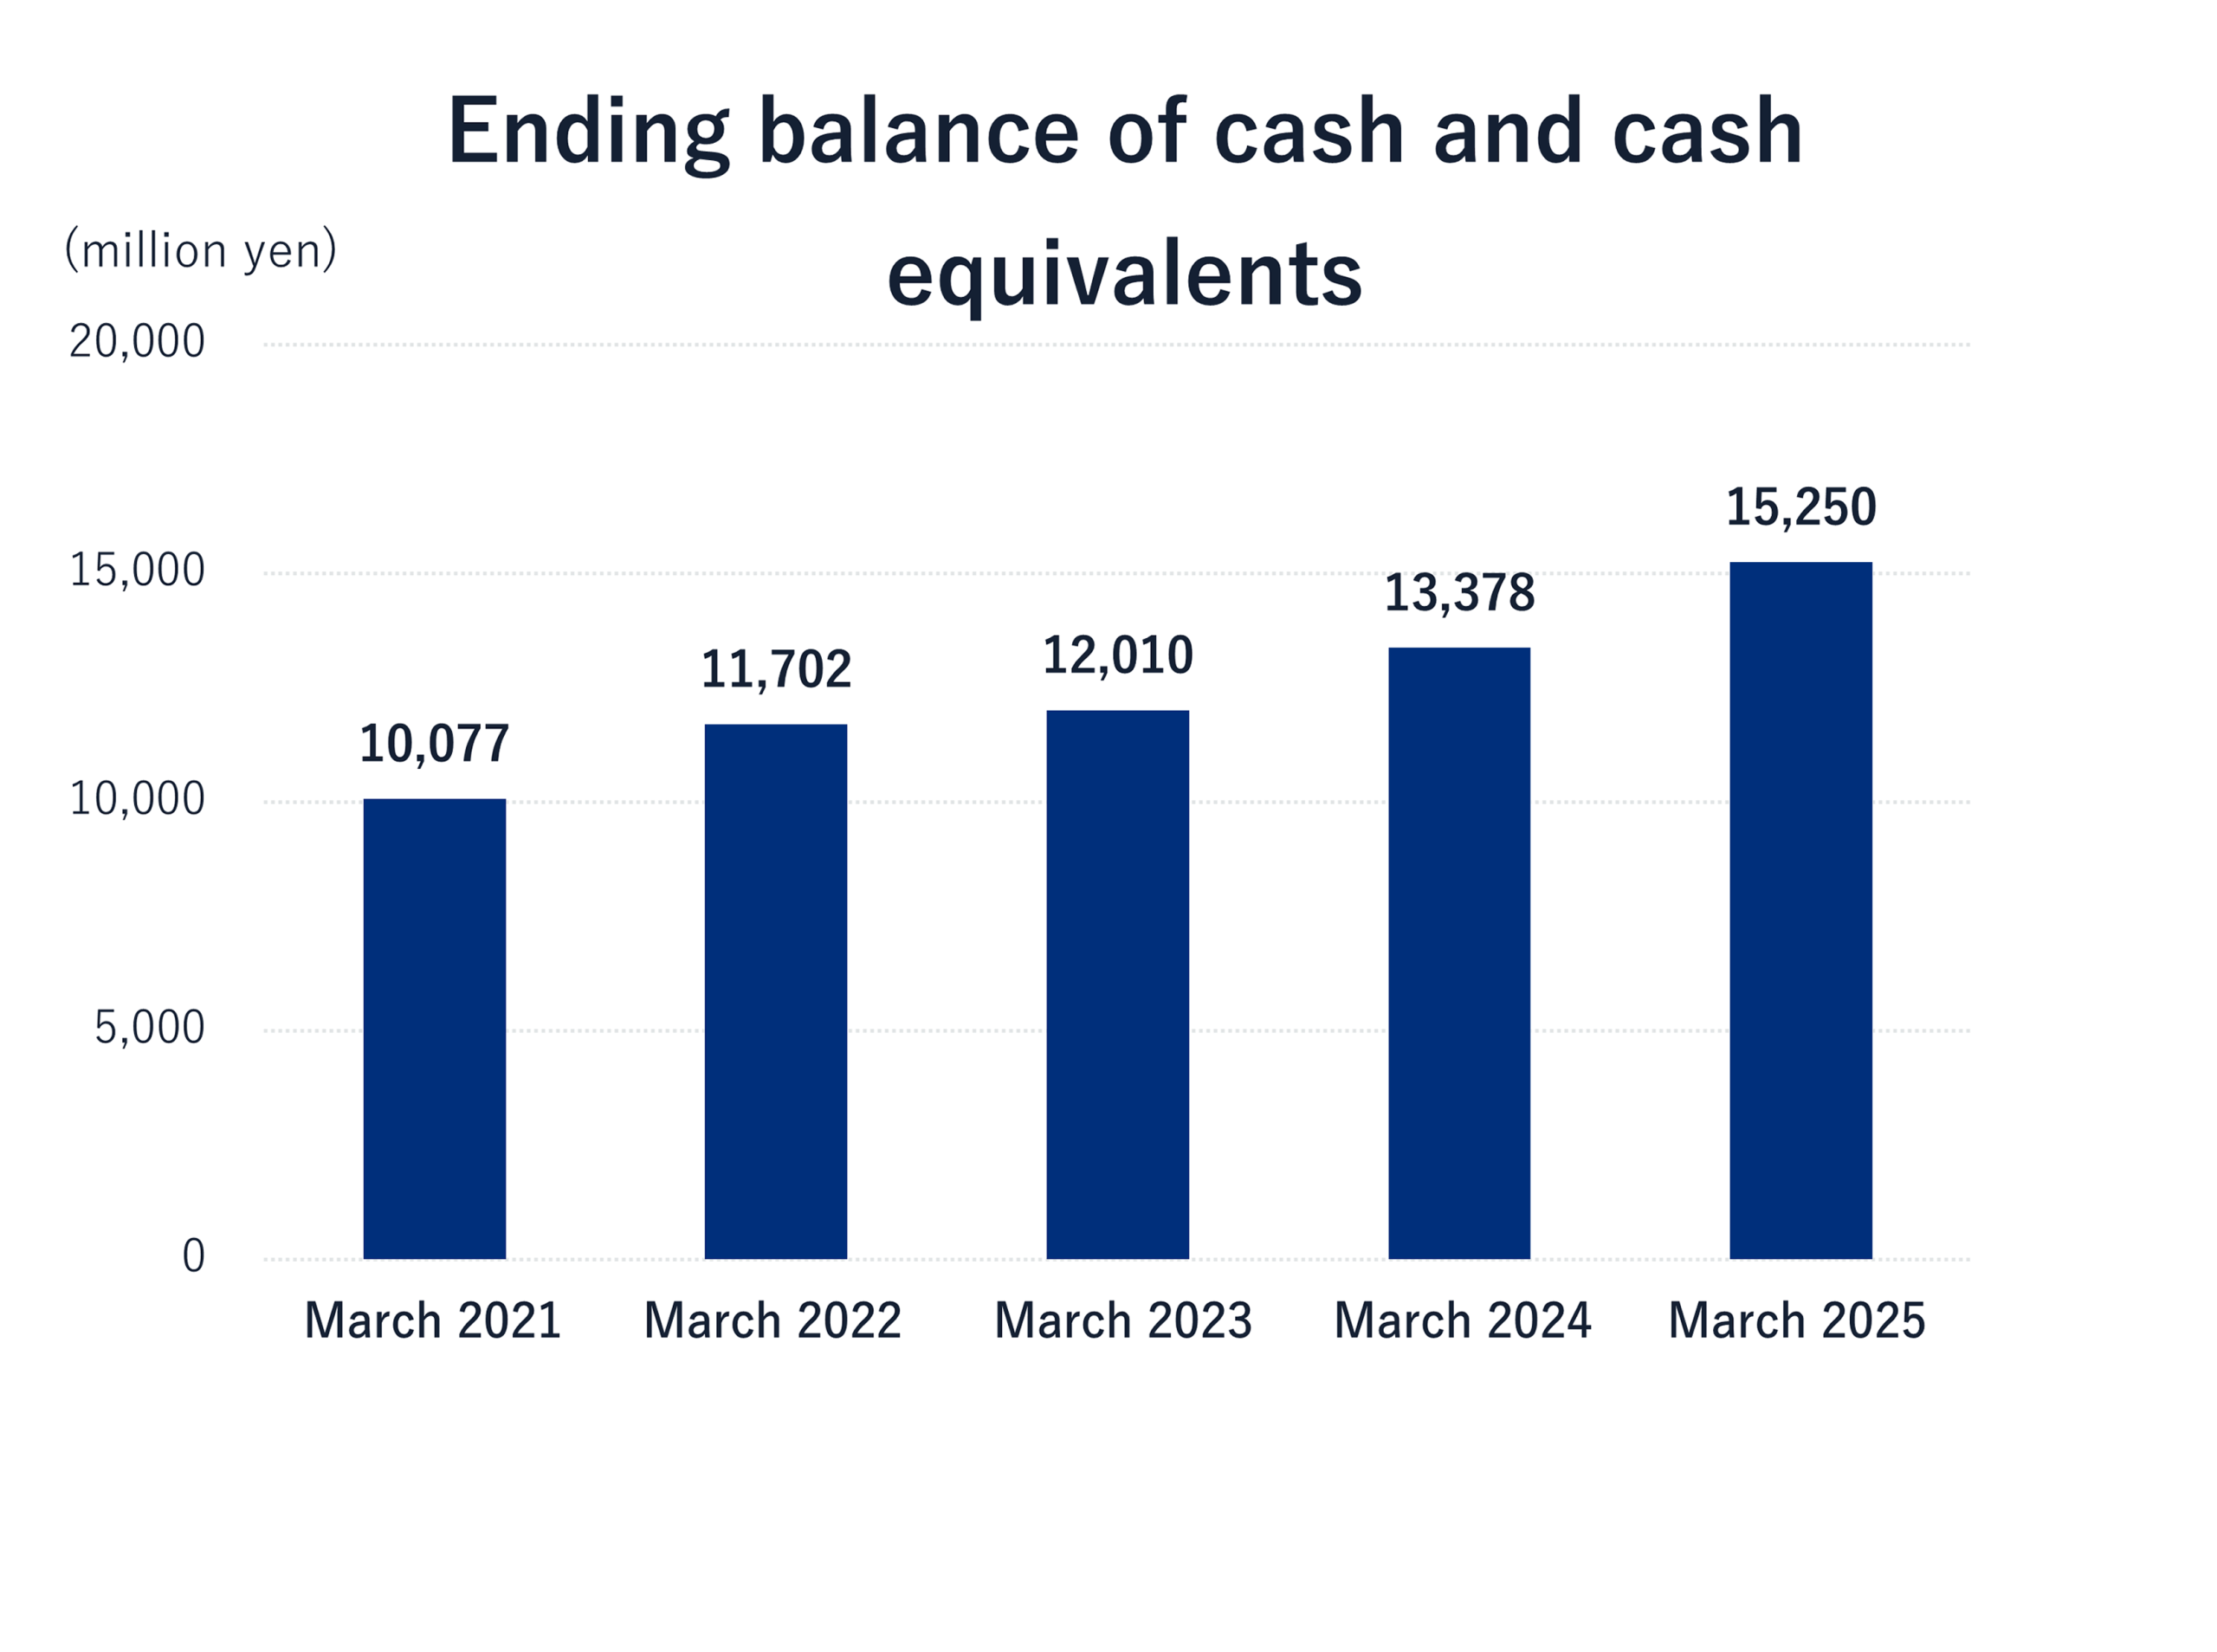
The contents of this data are based on the financial statements.
IR Information
Financial and Performance Information
Stock-related
IR Materials
Management Policy
IR Calendar
Stock Administration FAQs
Public Announcement
Disclaimer
Home
IR Information
Financial and Performance Information